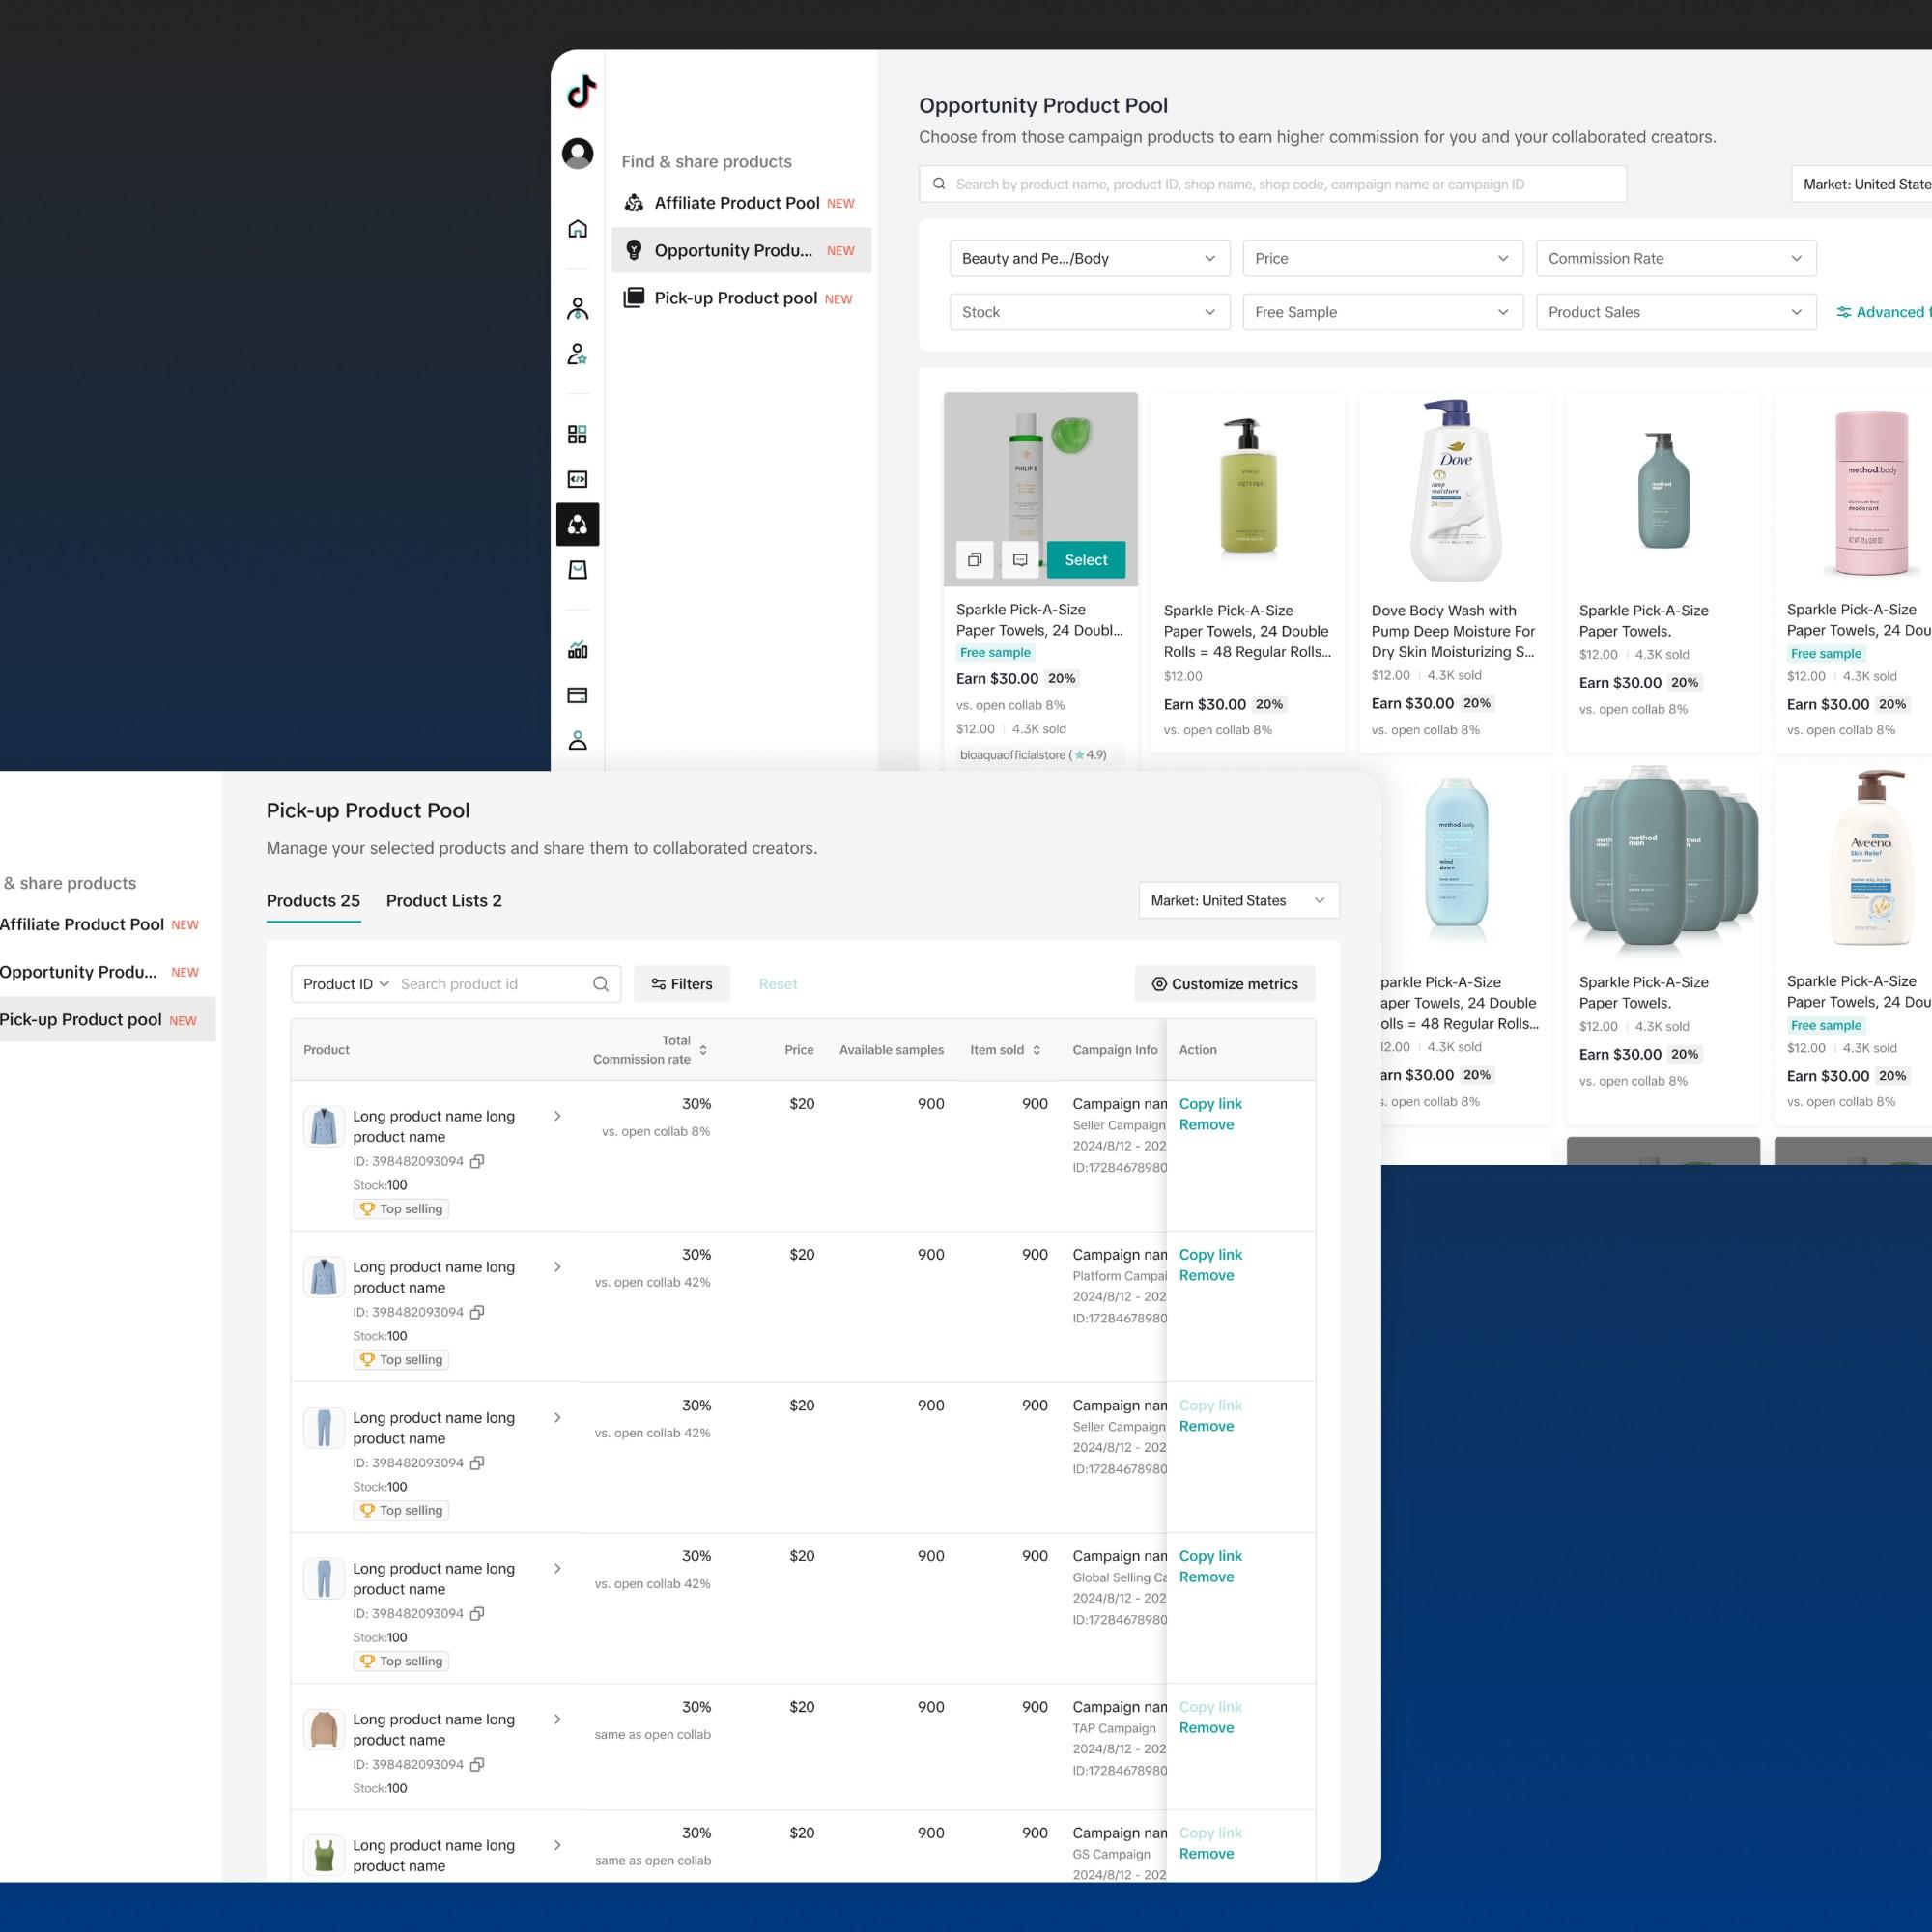
Turning live-stream data into actionable items for creators.
Collaborator
Yilin Wang
Jingyi Zhou (sr. designer)
Timeline
2 month, 2024
Scope
Solution ideation, UX design, usability testing
Key design metrics
What the design moved
Suggestion adoption
20.8% → 26.9%
Adoption rate after going from multiple suggestion cards to a single card.
Livestream length
+1.5%
Longer livestreams for creators with the suggestion card feature.
Problem
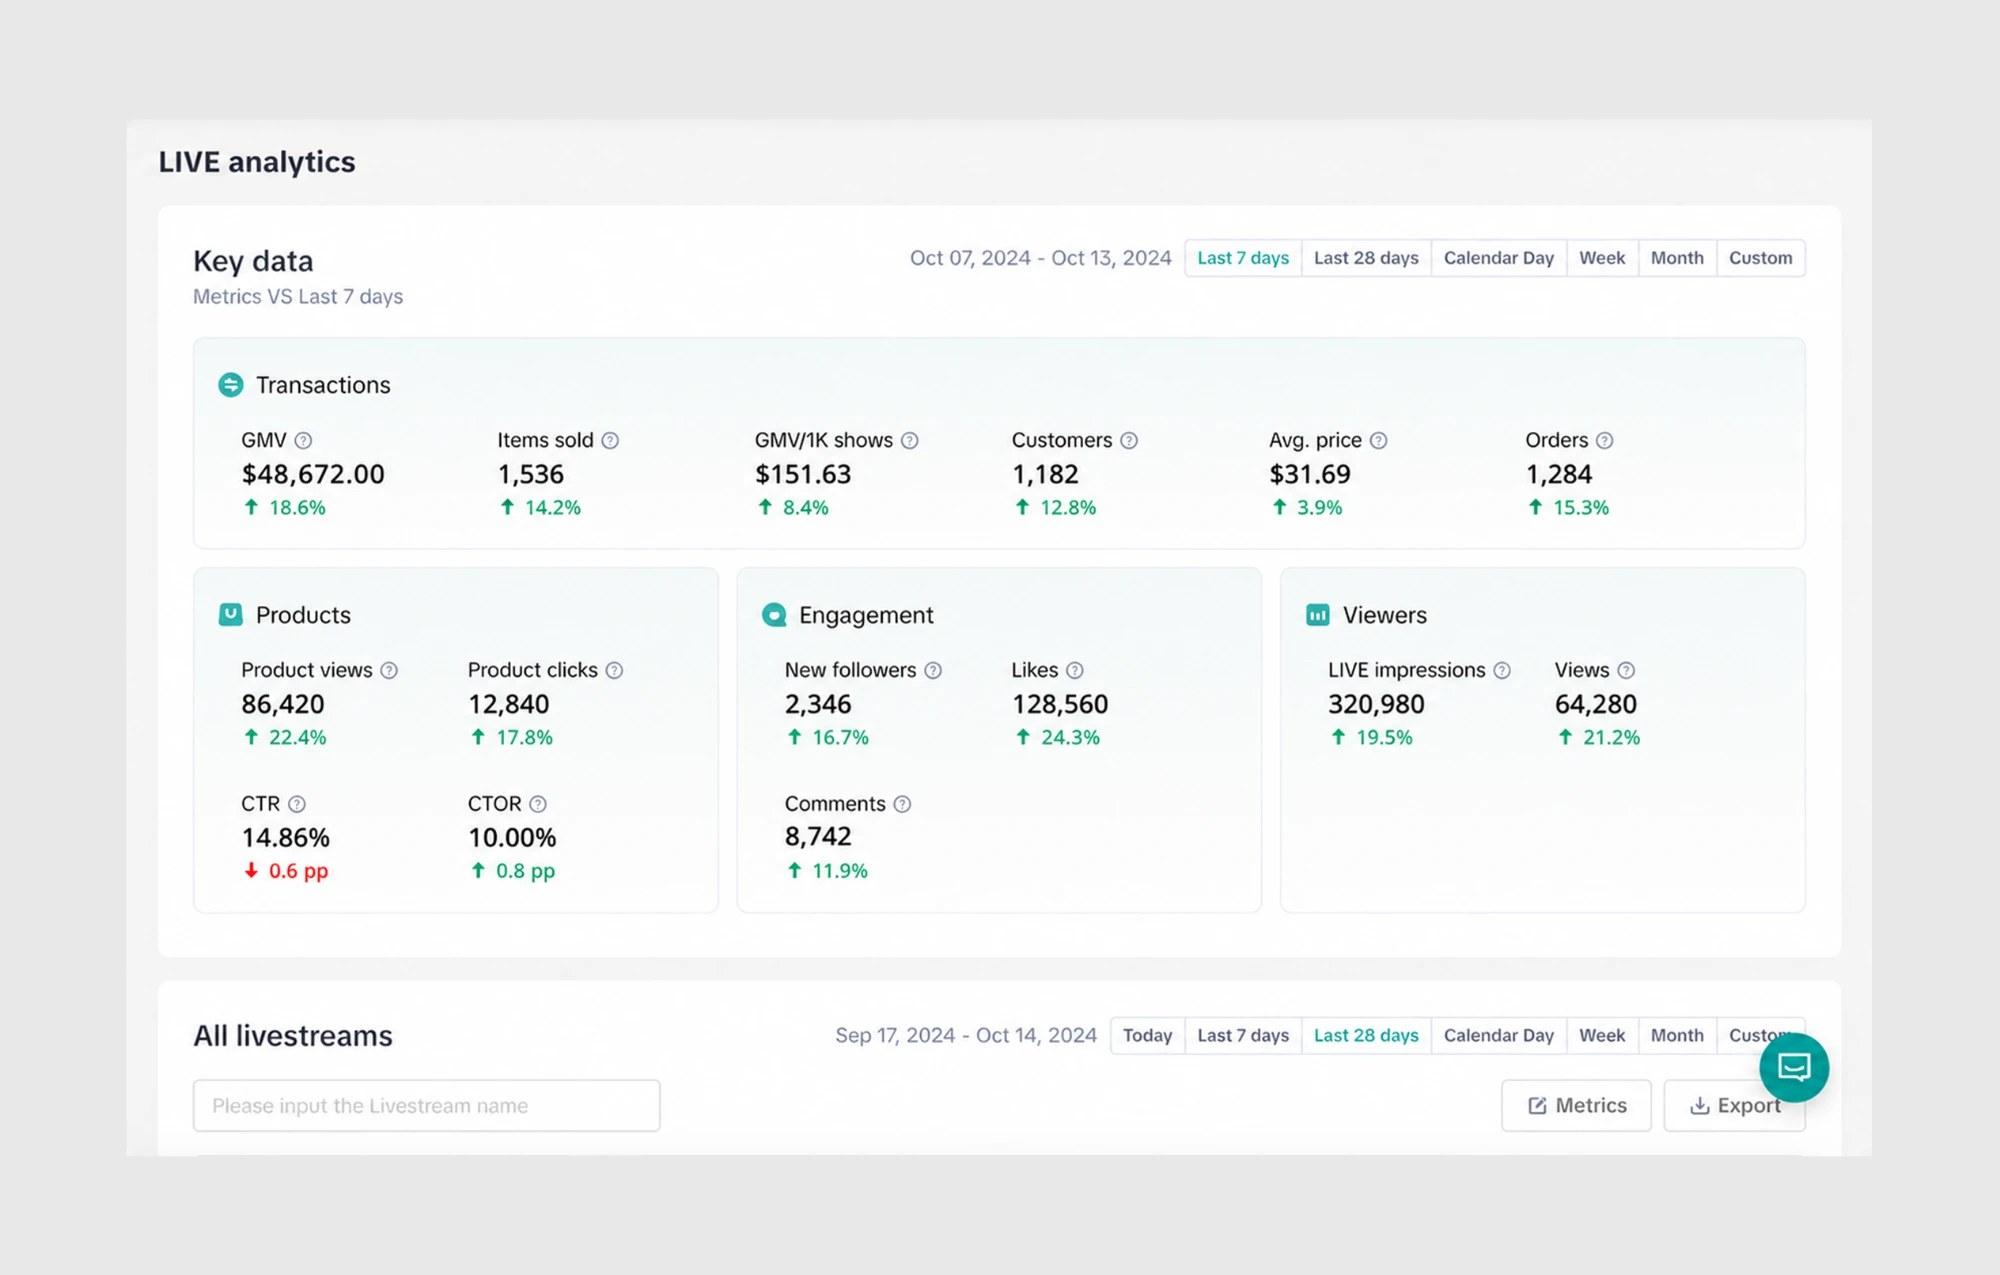
TikTok Shop gives sellers detailed LIVE analytics, but for entry-level teams, more data isn't leading to better streams.
As a result, streams generate lower GMV, and many new creators give up on TikTok LIVE altogether.
User Research
Working with a PM and 3 user researchers, we found two reasons the data wasn't helping.
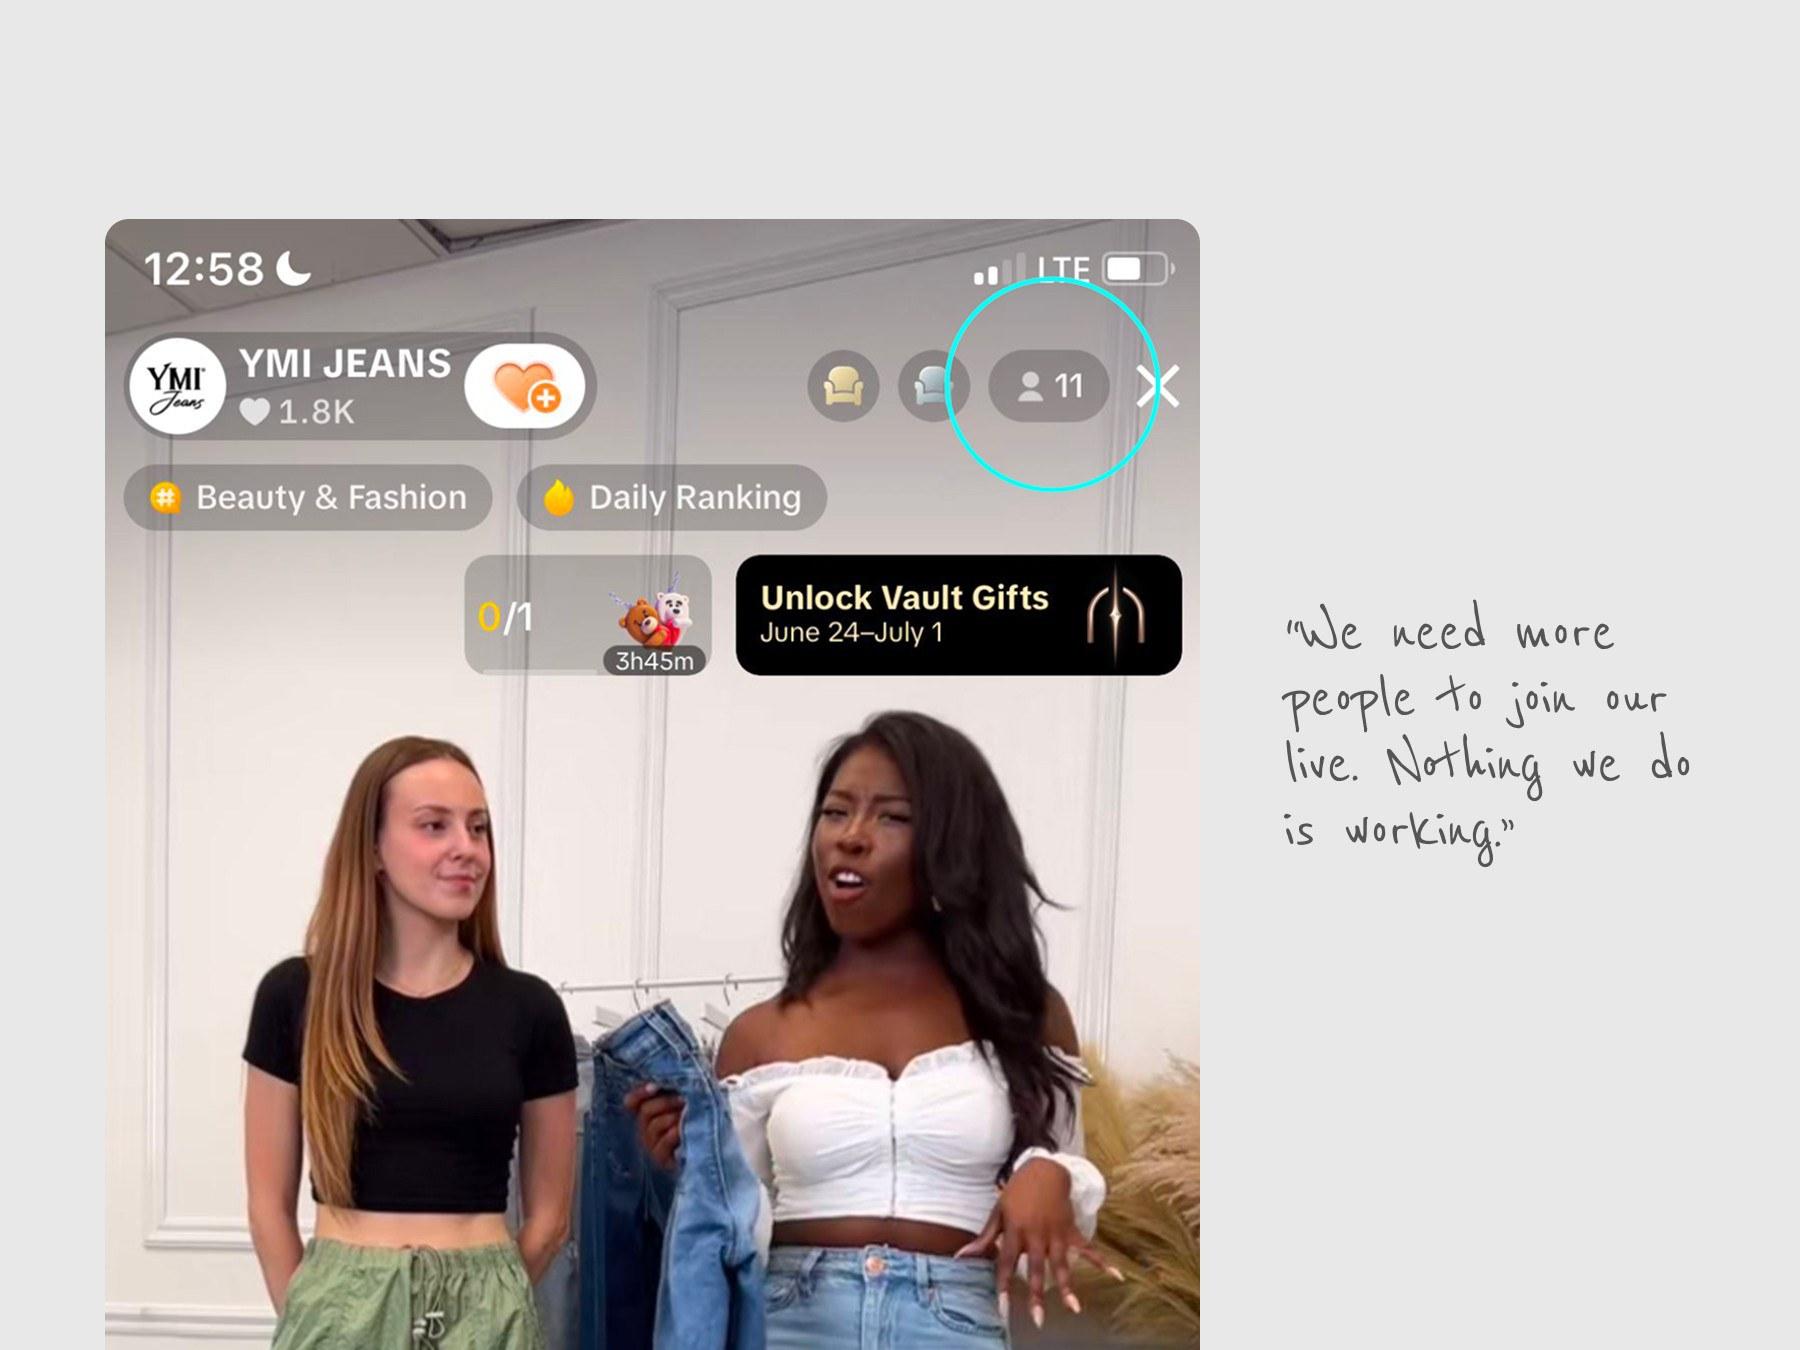
They don't know what the numbers mean, or what to do about them
Entry-level sellers can't tell whether a metric is good or bad, and don't know which actions would improve it.
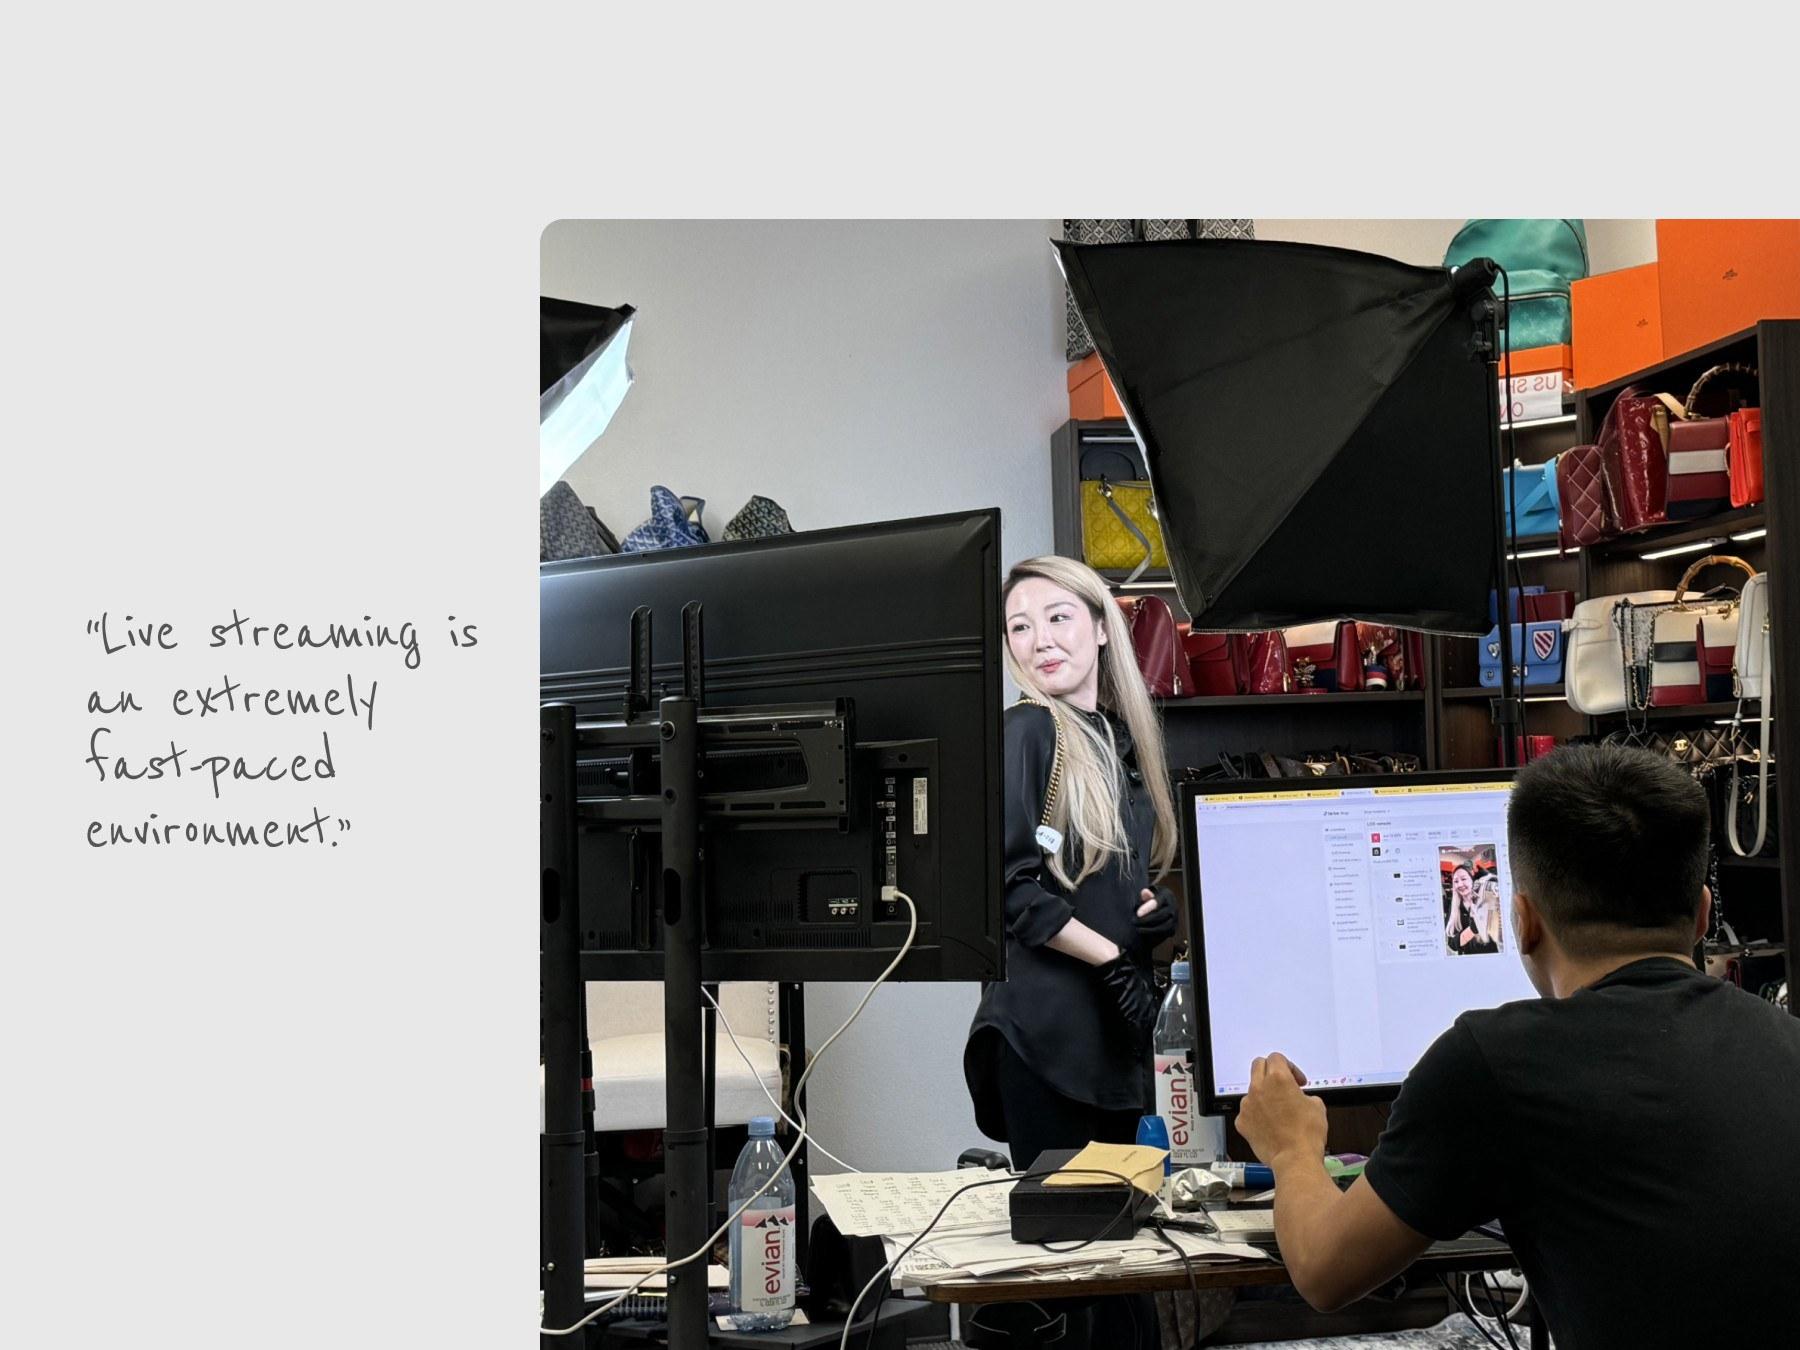
There's no time to analyze data during a LIVE
While they're running the stream, managing products and chat, teams can't stop to read complex data and decide what to do next.
Problem
How might we turn LIVE data into clear next steps that sellers can act on in seconds, without adding to their cognitive burden?
Primary success metric
GMV per stream, average watch time, and conversion rate.
Leading indicators
How often solutions are acted on, the time from problem to action, and the share of creators who complete the solution flow.
Solution Ideation
During LIVE or After LIVE?
Direction 1 - LIVE Pulse
Display key metrics that need attention after each live-stream for creators to learn and review.
Direction 2 - LIVE Actions
Notify users when key metrics need attention during the live stream, with actionable solutions.
Design Evolution
Multiple suggestions vs. single suggestion
During a LIVE, the moderator is already juggling chat, products, and promotions. At the beginning, we showed a suggestion for every underperforming metric. Testing showed that sellers spent longer deciding which to act on, and often acted on none.
So we show only the highest-impact suggestion at a time, ranked by how far the metric has fallen.
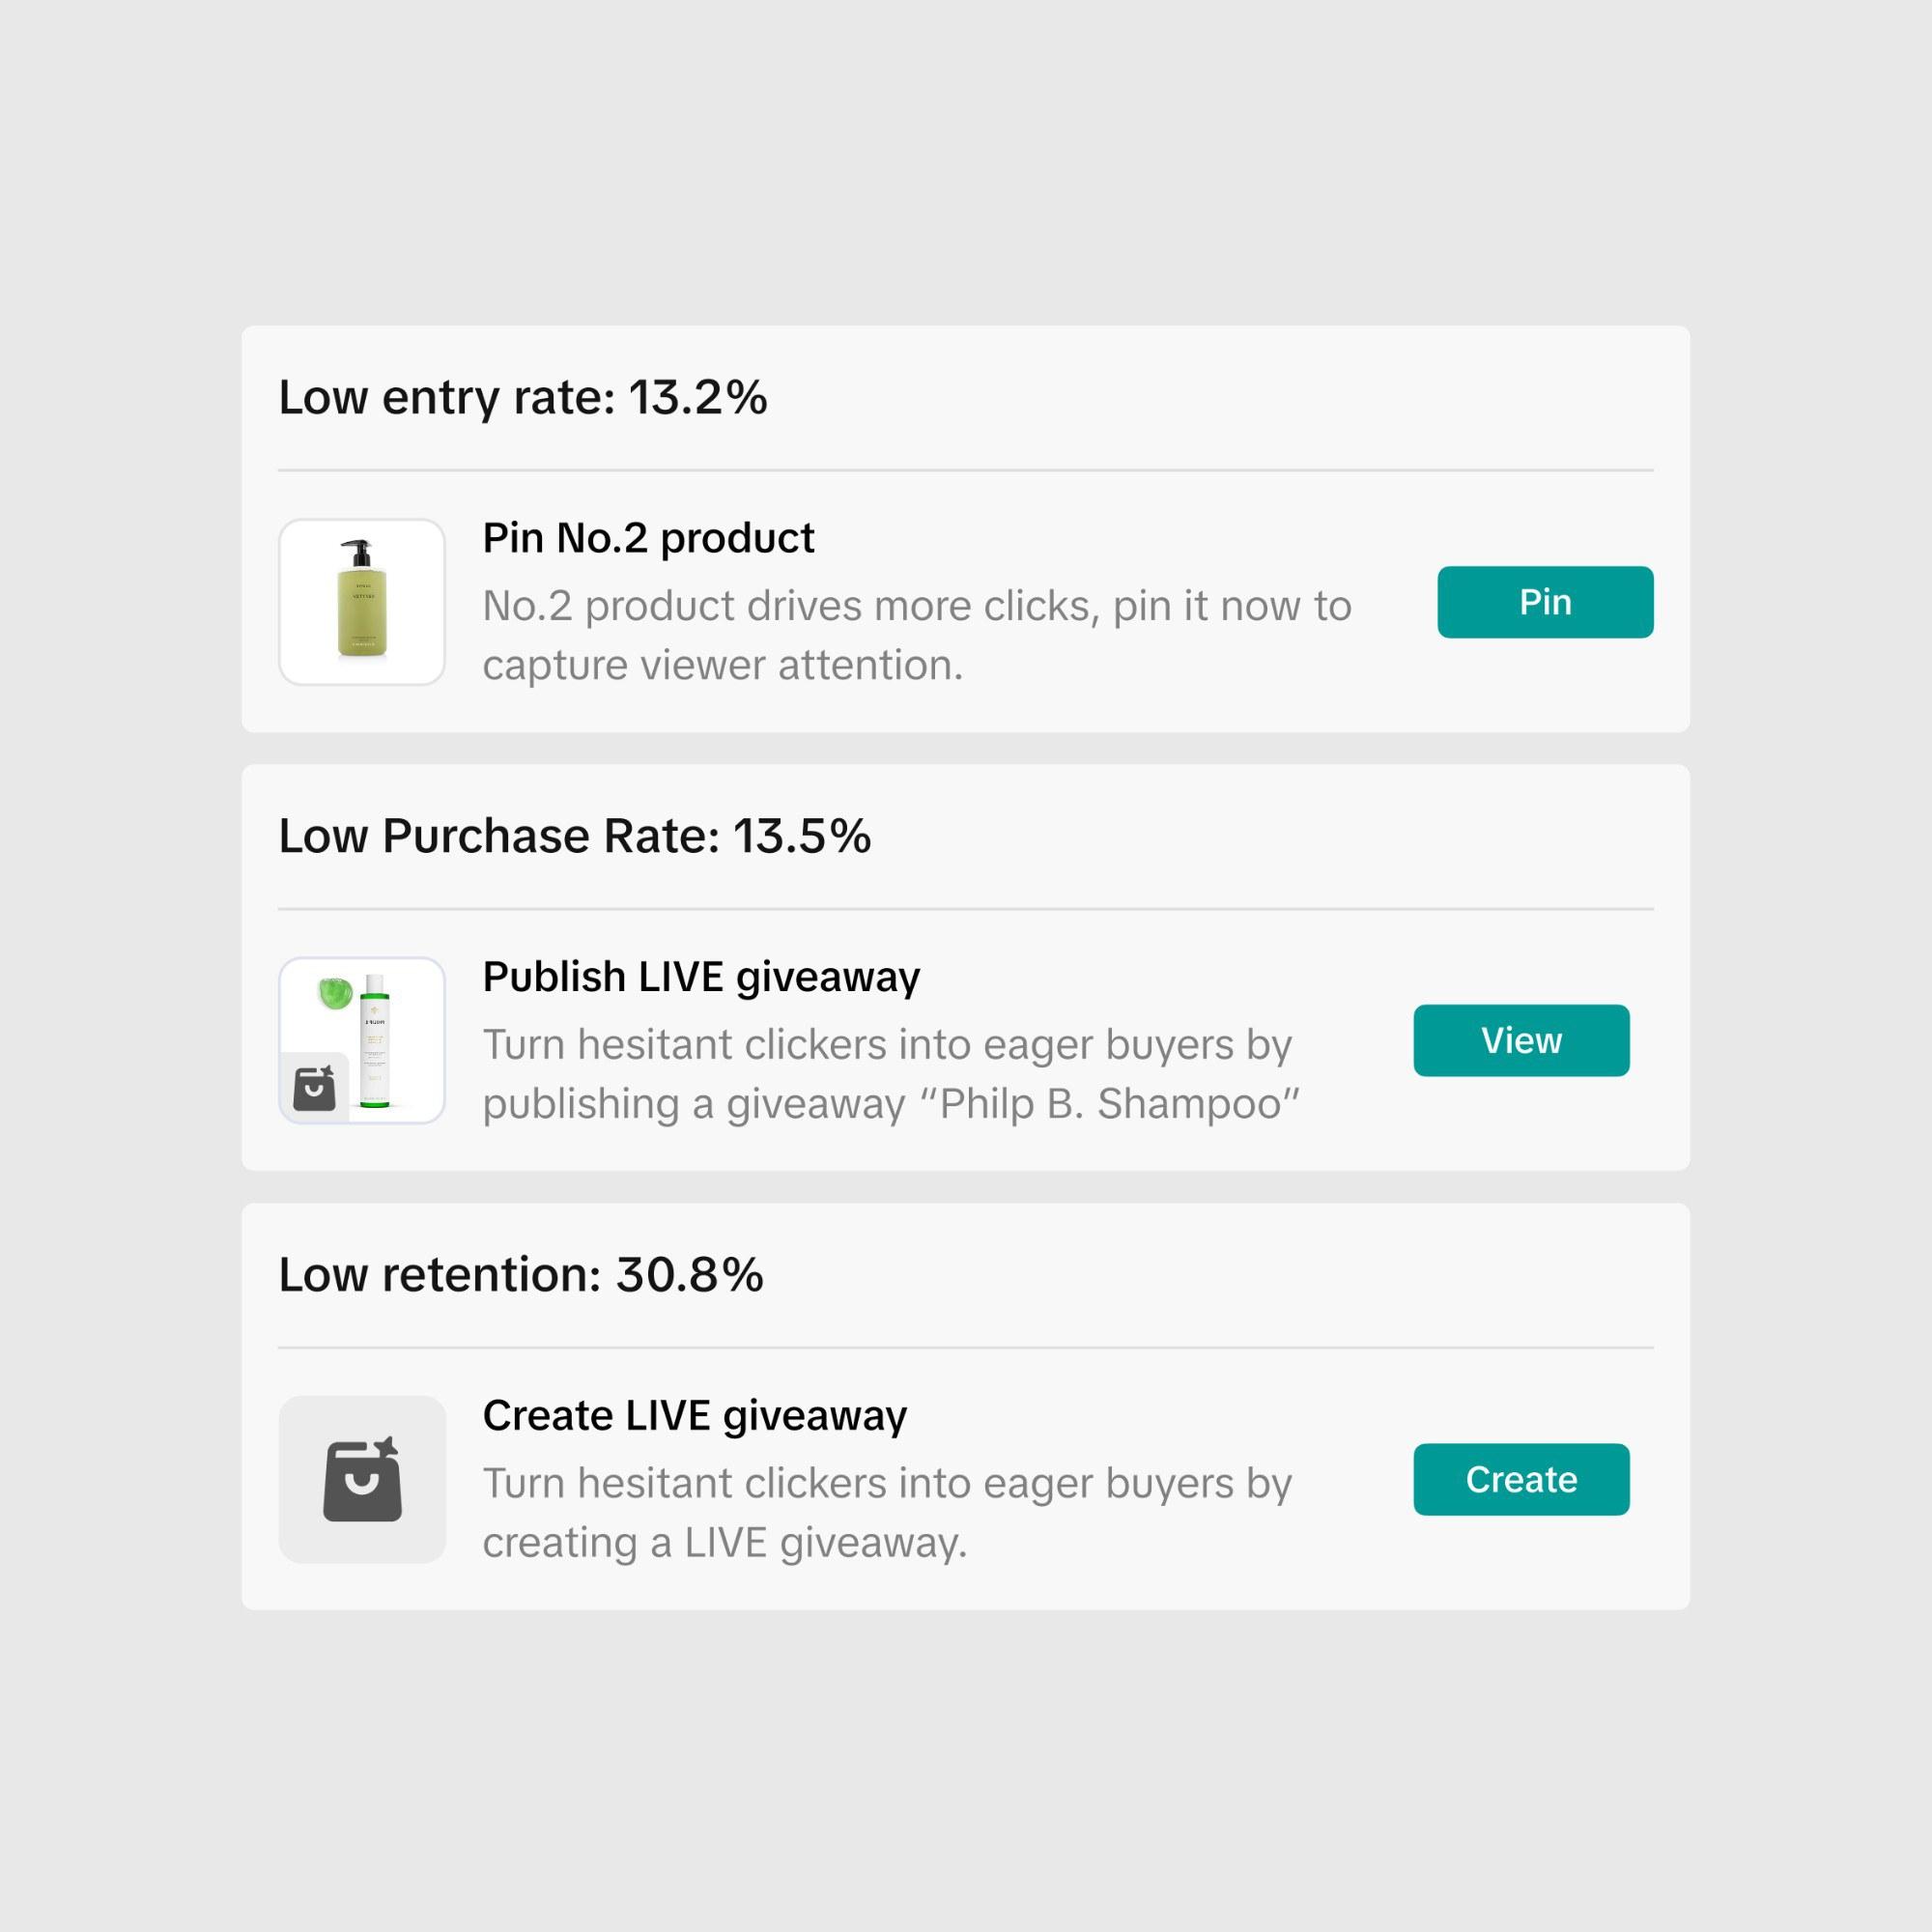
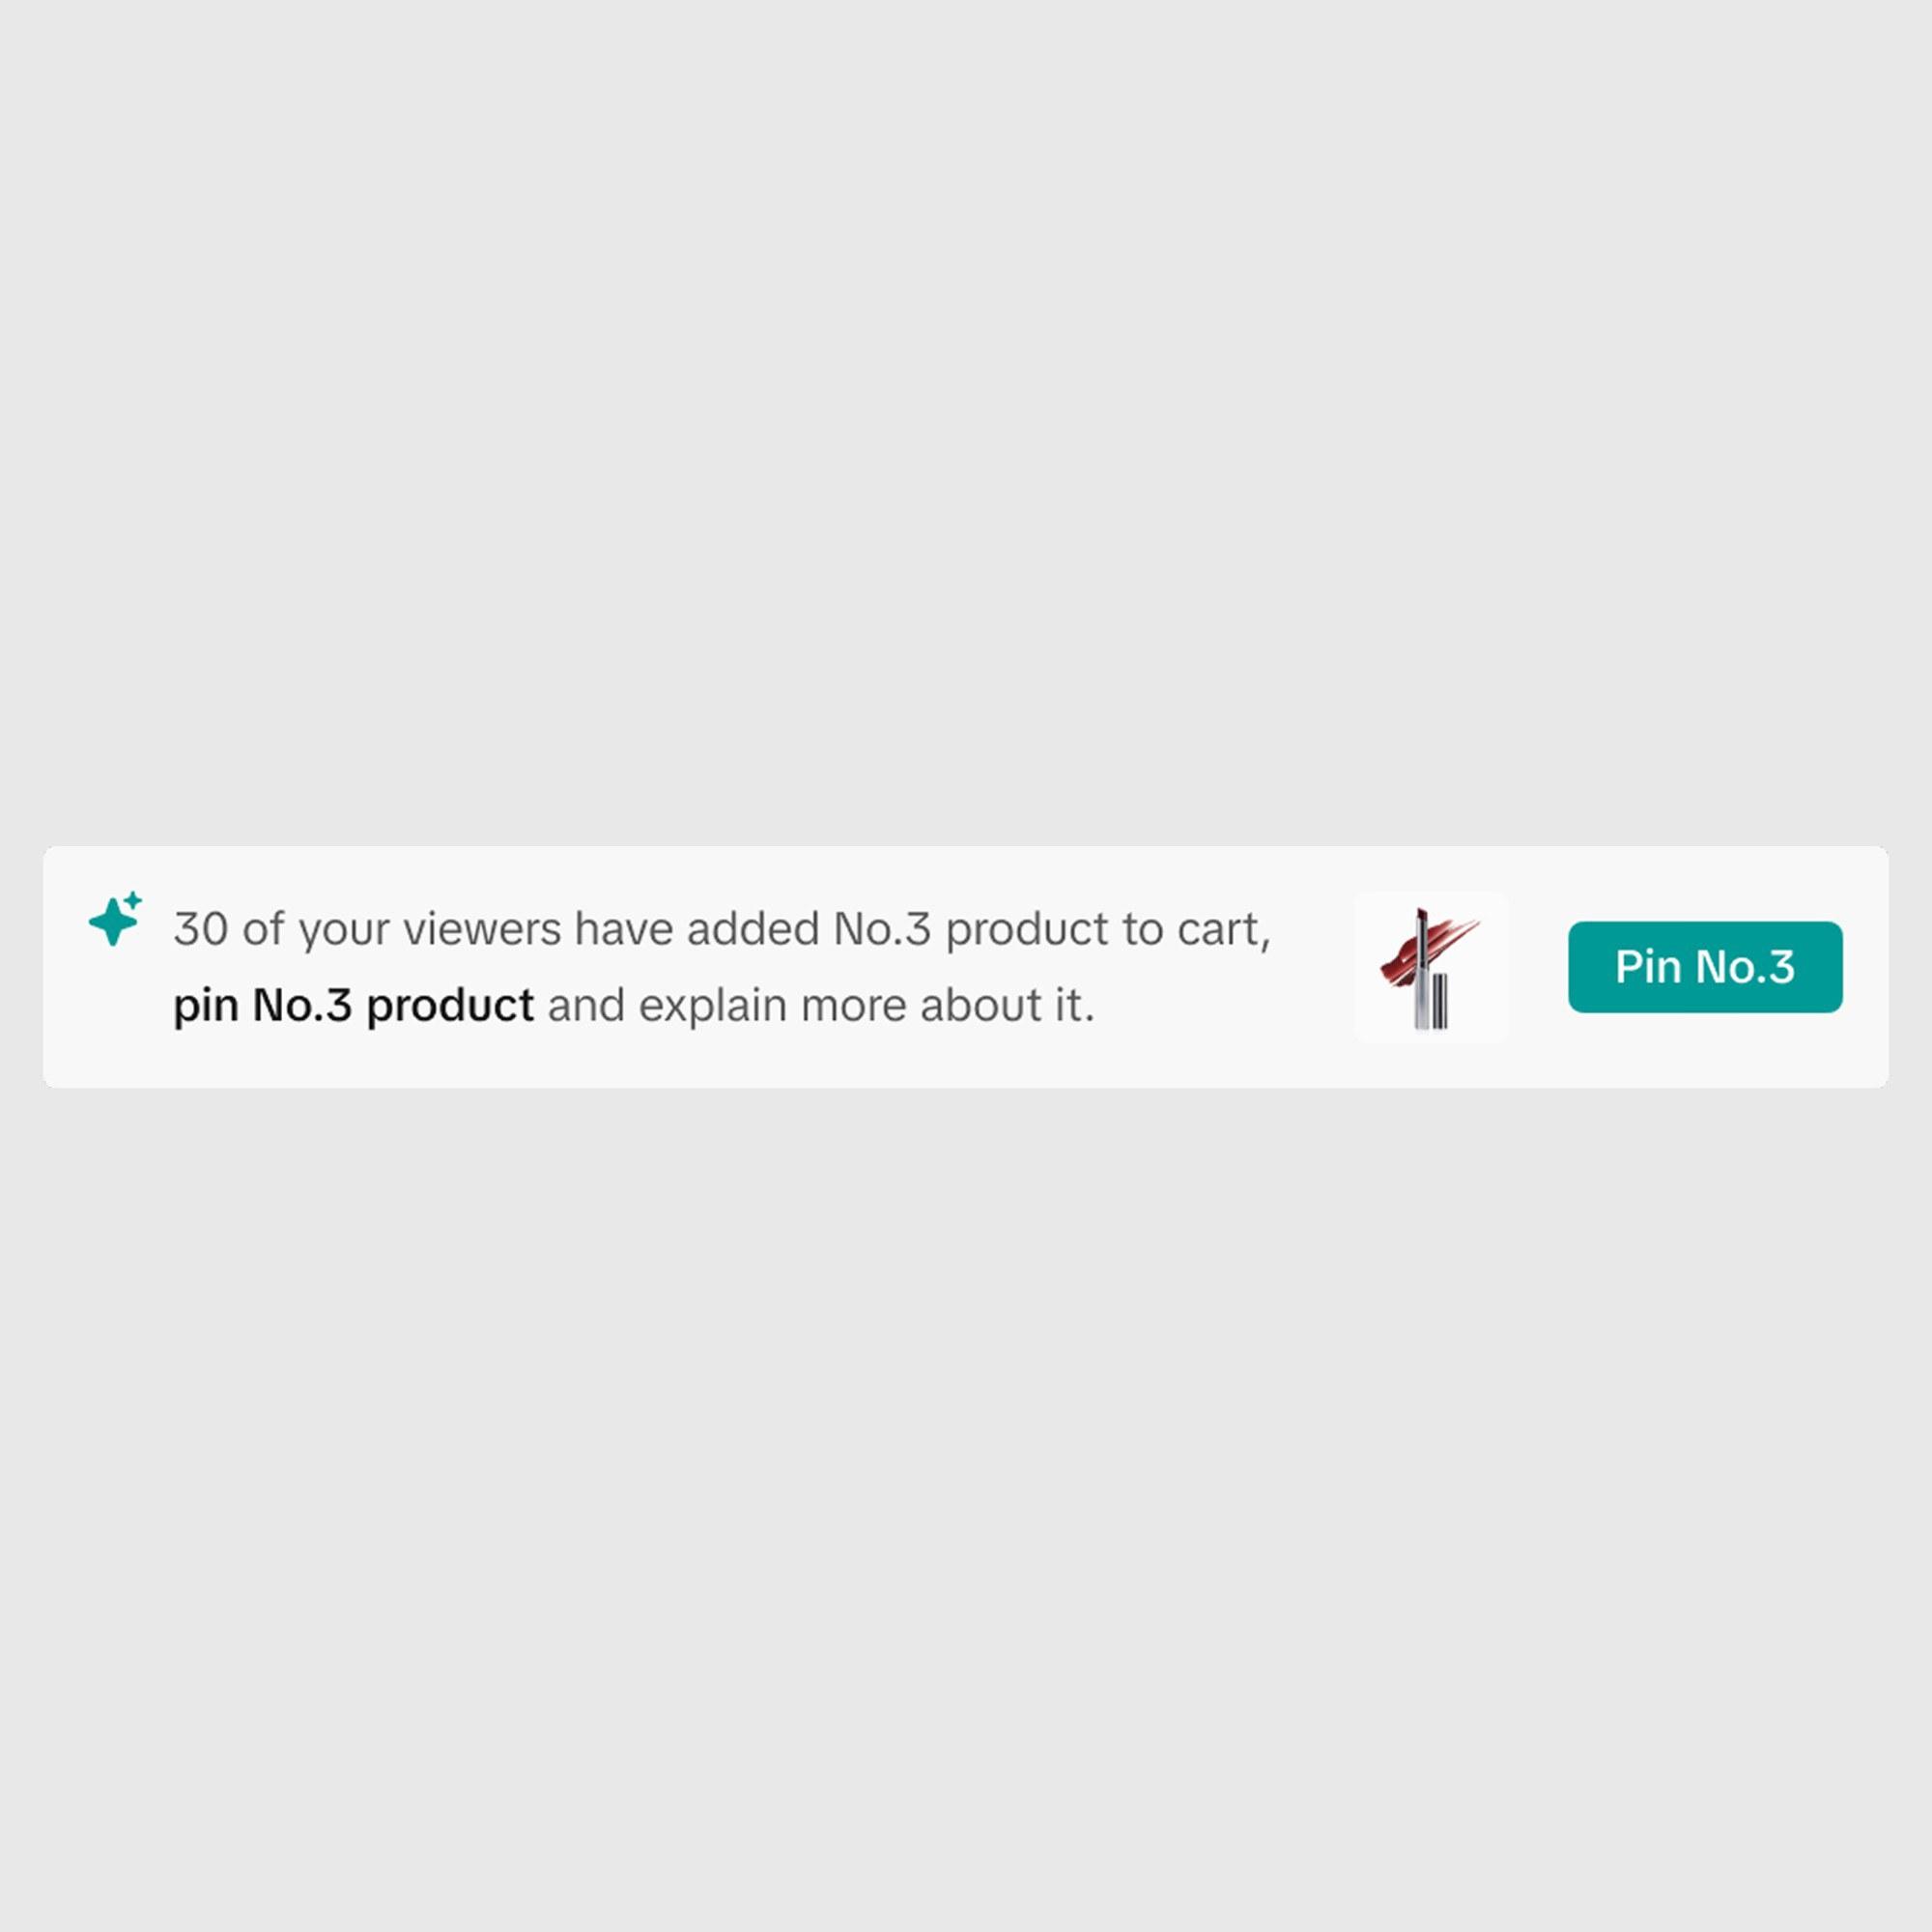
Where to place the feature?
We needed a suggestion card to be seen without being intrusive.
Among the three options, the popover hid the suggestion behind a click, and the banner covered the stream. Eventually, we decided to add a fixed slot beside the chat. This ensures visibility without disruption.
When a metric falls behind, its tile in the top bar turns red, and one click opens a recommendation right where the team is already looking, without leaving the live console.
A suggestion banner slides in over the live video, right where the team is watching, with one click to act or dismiss.
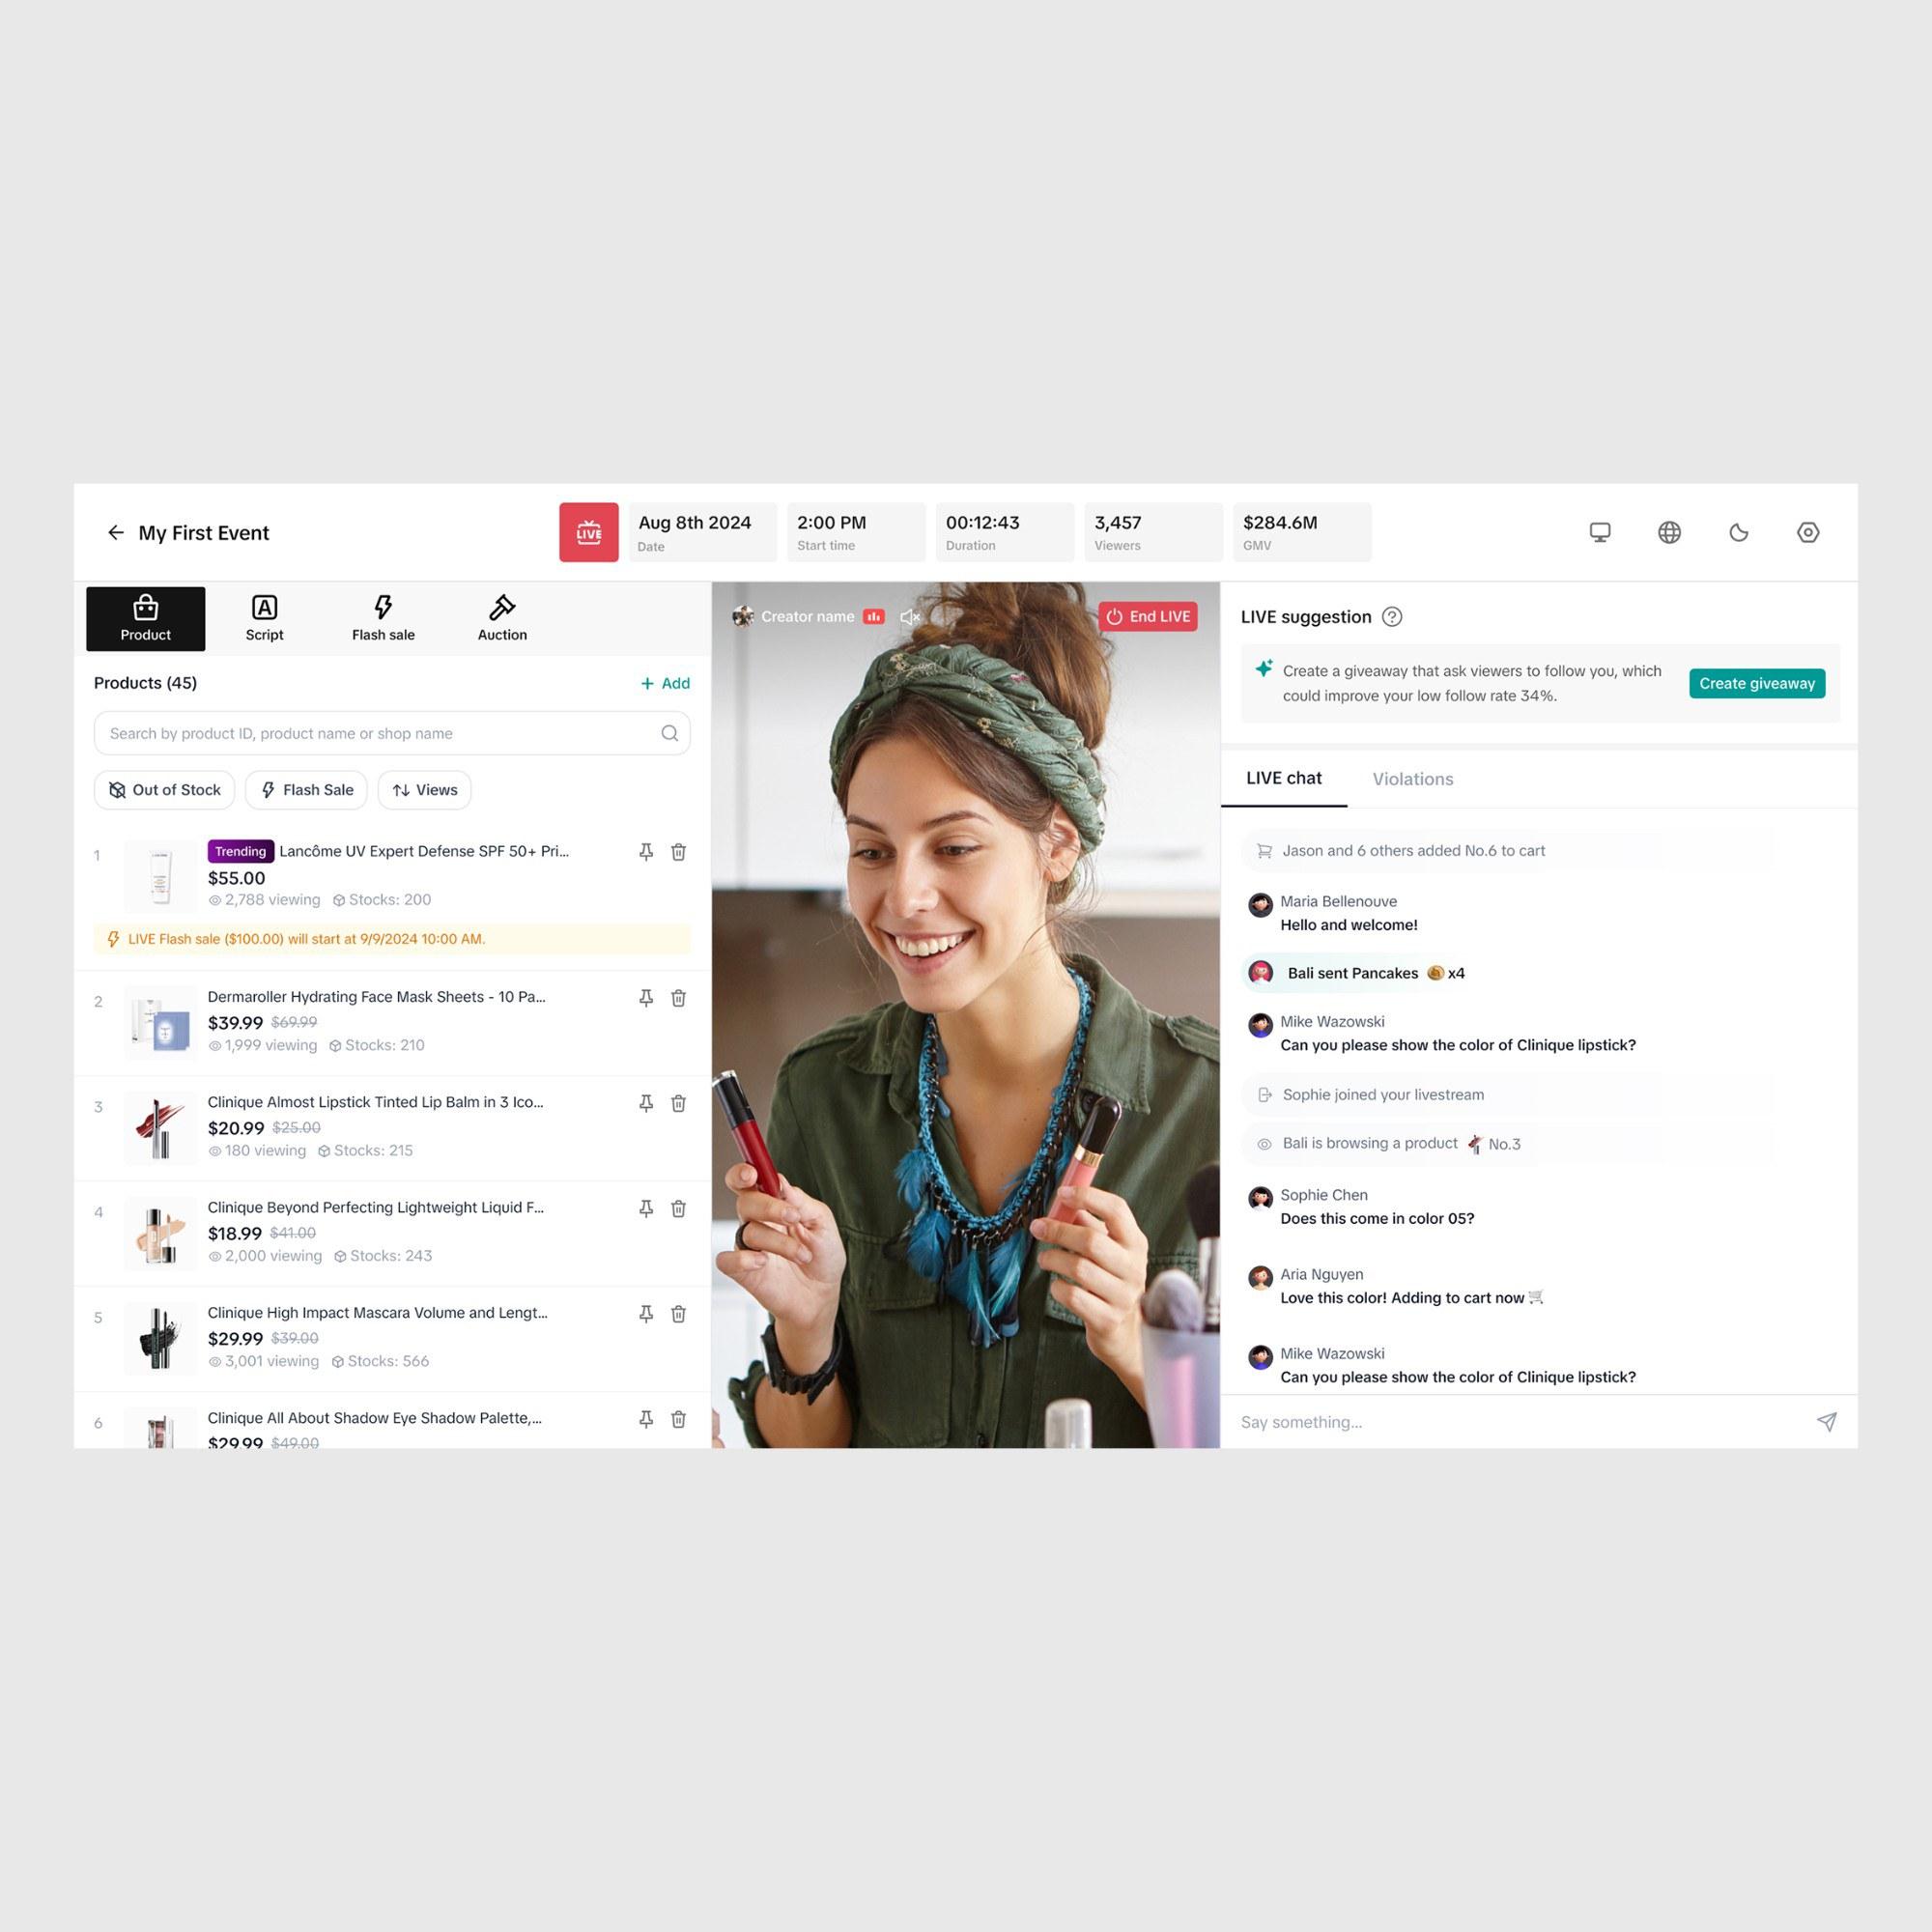
Suggestions live in a dedicated module above LIVE chat, so the next action is always in view without switch tap and covering the video.
Final design
Compatible for different suggestion types.
Key learnings
What I took away
- 01
One clear action beats a list of options
Going from multiple suggestion cards to a single one lifted adoption from 20.8% to 26.9%. Mid-stream, every extra choice is a decision the team has no time to make.
- 02
Design for the moment, not the dashboard
Teams can't stop to analyze data while they're running a LIVE. Guidance had to arrive in real time, beside chat, where they were already looking.
- 03
Data only helps when it says what to do next
Entry-level sellers couldn't tell whether a number was good or bad. Pairing a metric with one concrete action mattered more than showing more metrics.