Turning market noise into answers for retail investors
Collaborator
Yilin Wang
3 Product Managers
8 AI Engineers
Timeline
2023 - 2025
Scope
Brand → AI product design
Key design metrics
What the design moved
User retention
40% / 32% / 24%
Day 1, Day 7, and Day 30 retention.
Follow-up rate
20.8% → 35.3%
After adding AI data visualization skills to the conversational AI feature.
View Ask CapyDaily active users
10K
DAU within one month of launching the MVP.
Problem
Retail investors have more financial news than ever, but no easy way to connect it to their own holdings.
To understand a single market move, they jump between news sites, brokerage apps, and social media, then piece together the story themselves.
Solution
Catch up on what happened within a minute
Open the app to see how your portfolio moved, and the news behind it.
Understand what the news means for you
Ask Capy turns the numbers into clear answers, so you get the story at a glance.
Research
What 20+ investor interviews told us about who we’re designing for
Working with the founder and 3 engineers, I used internal AI tools to synthesize transcripts from 20+ retail investor interviews, and the outcome revealed who we are designing for and their respective pain points.
Investors found news comes from multiple sources all the time. Because their holdings are scattered and various, it’s harder to find the related news.
Design Opportunity
synthesize all the information online, surface what matters to investors.
User Painpoint 1
Retail investors often struggle to get a full picture of market changes in a short time.
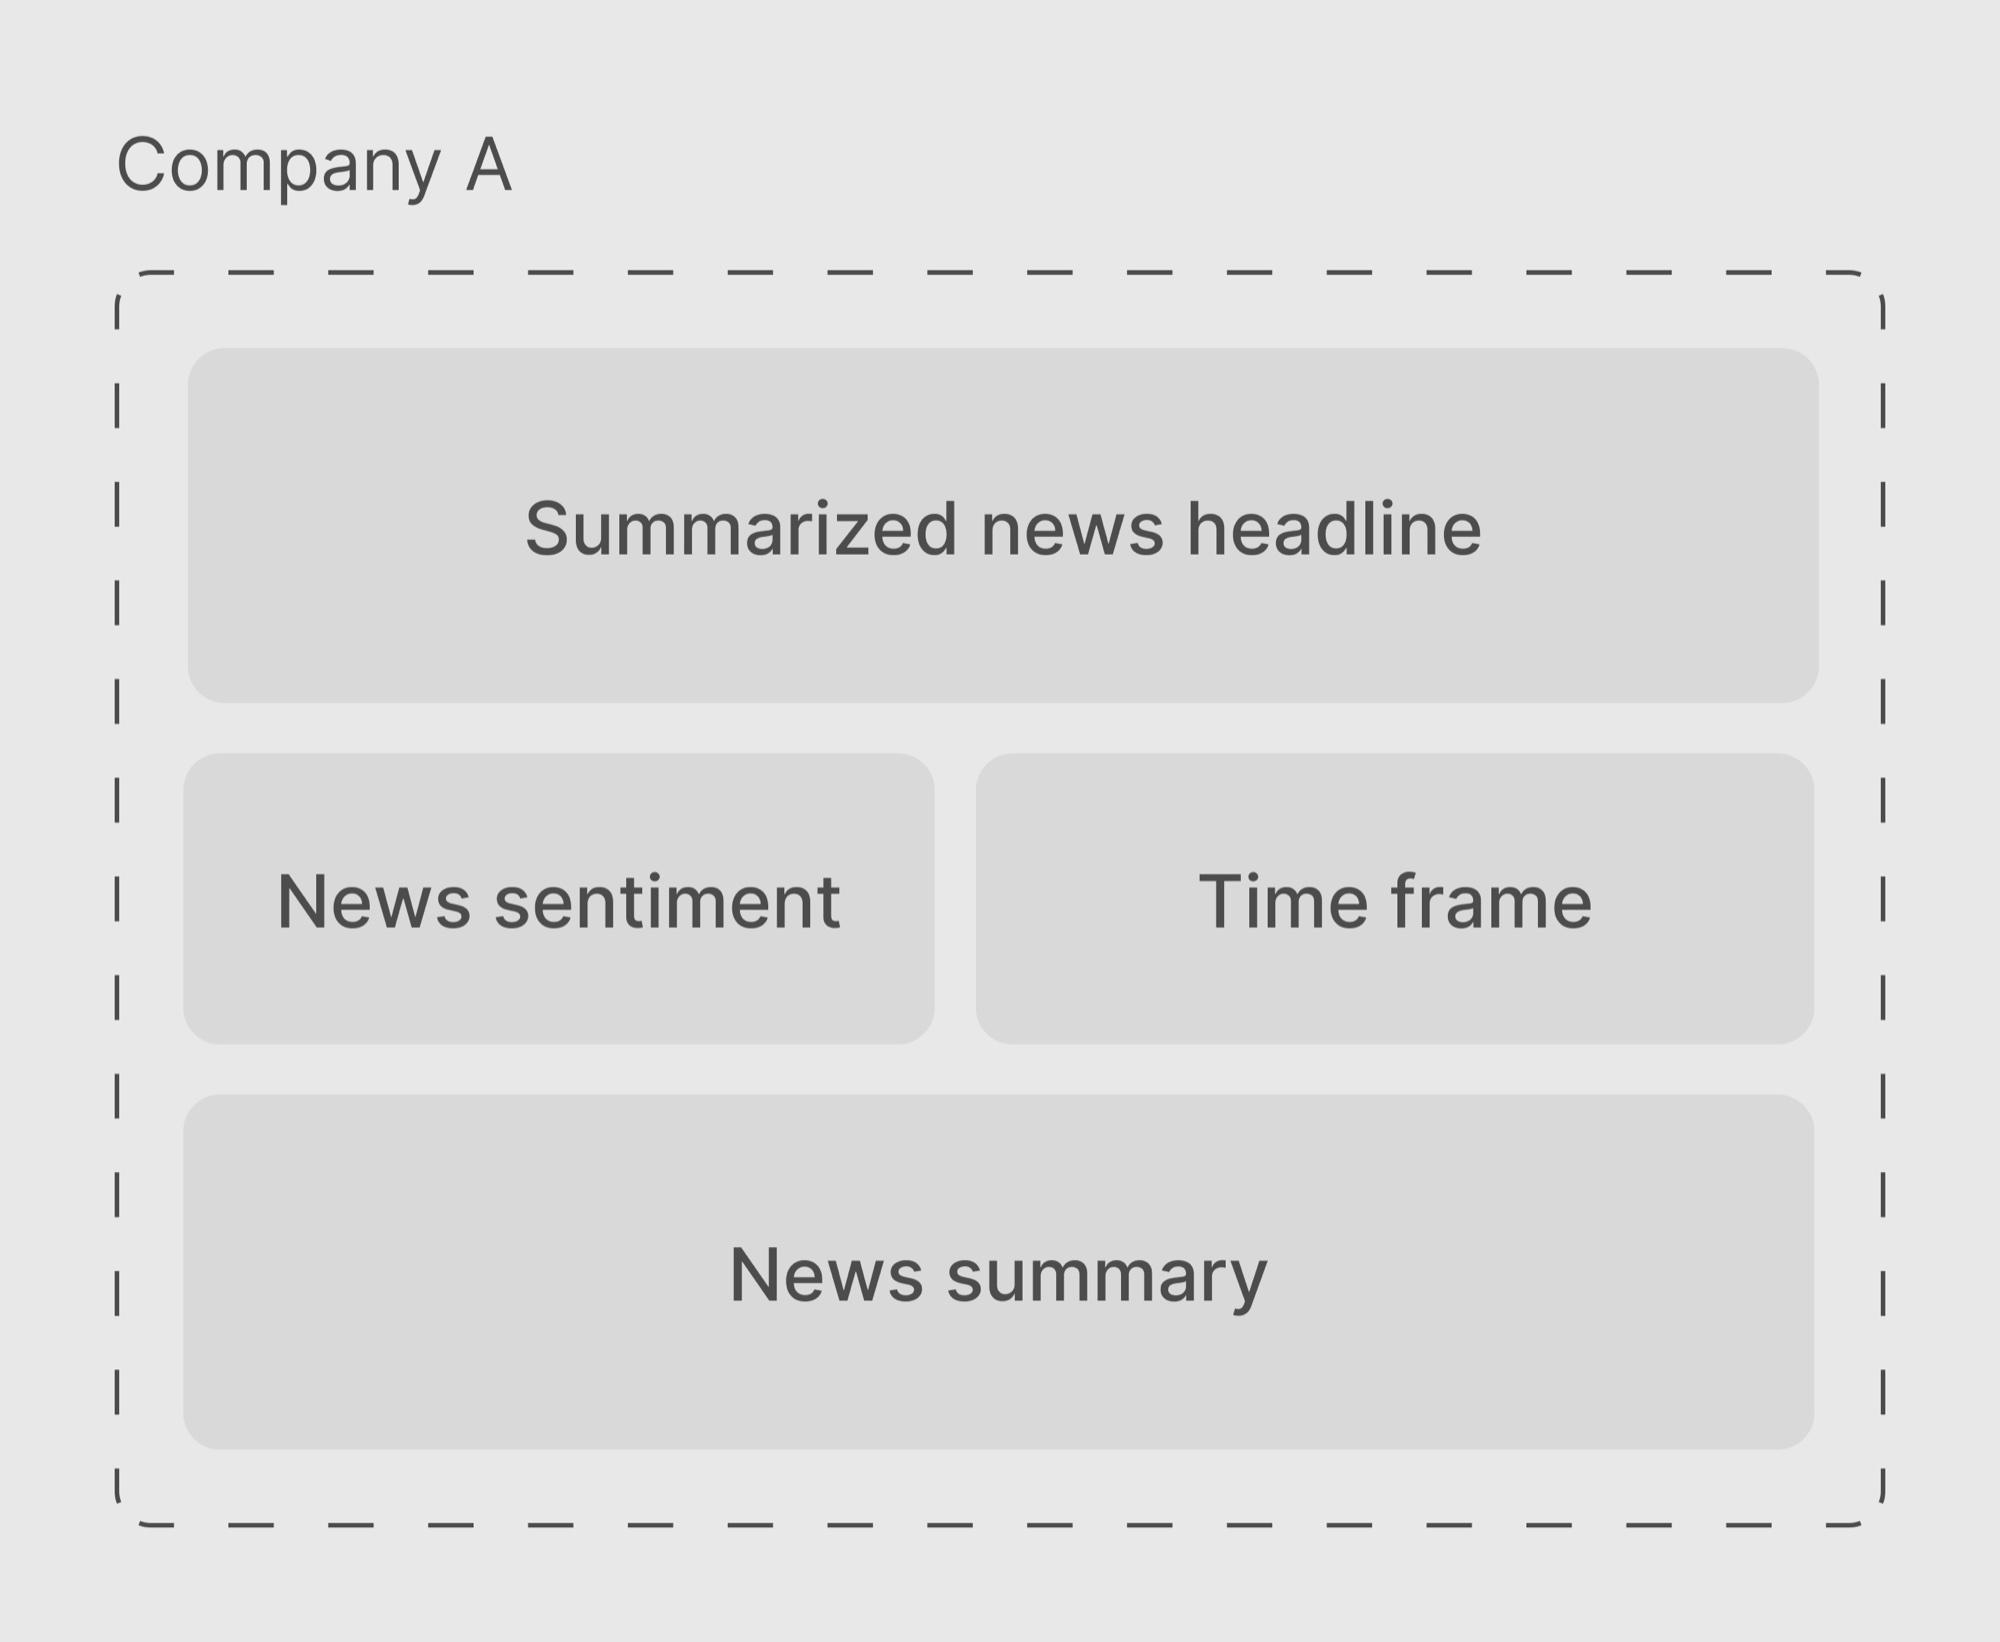
To tackle this problem, we decided to pull news from verified financial sources and then structure the summaries by companies.
Design Challenge
How might we surface the information that matters most to the retail investors?
Exploration
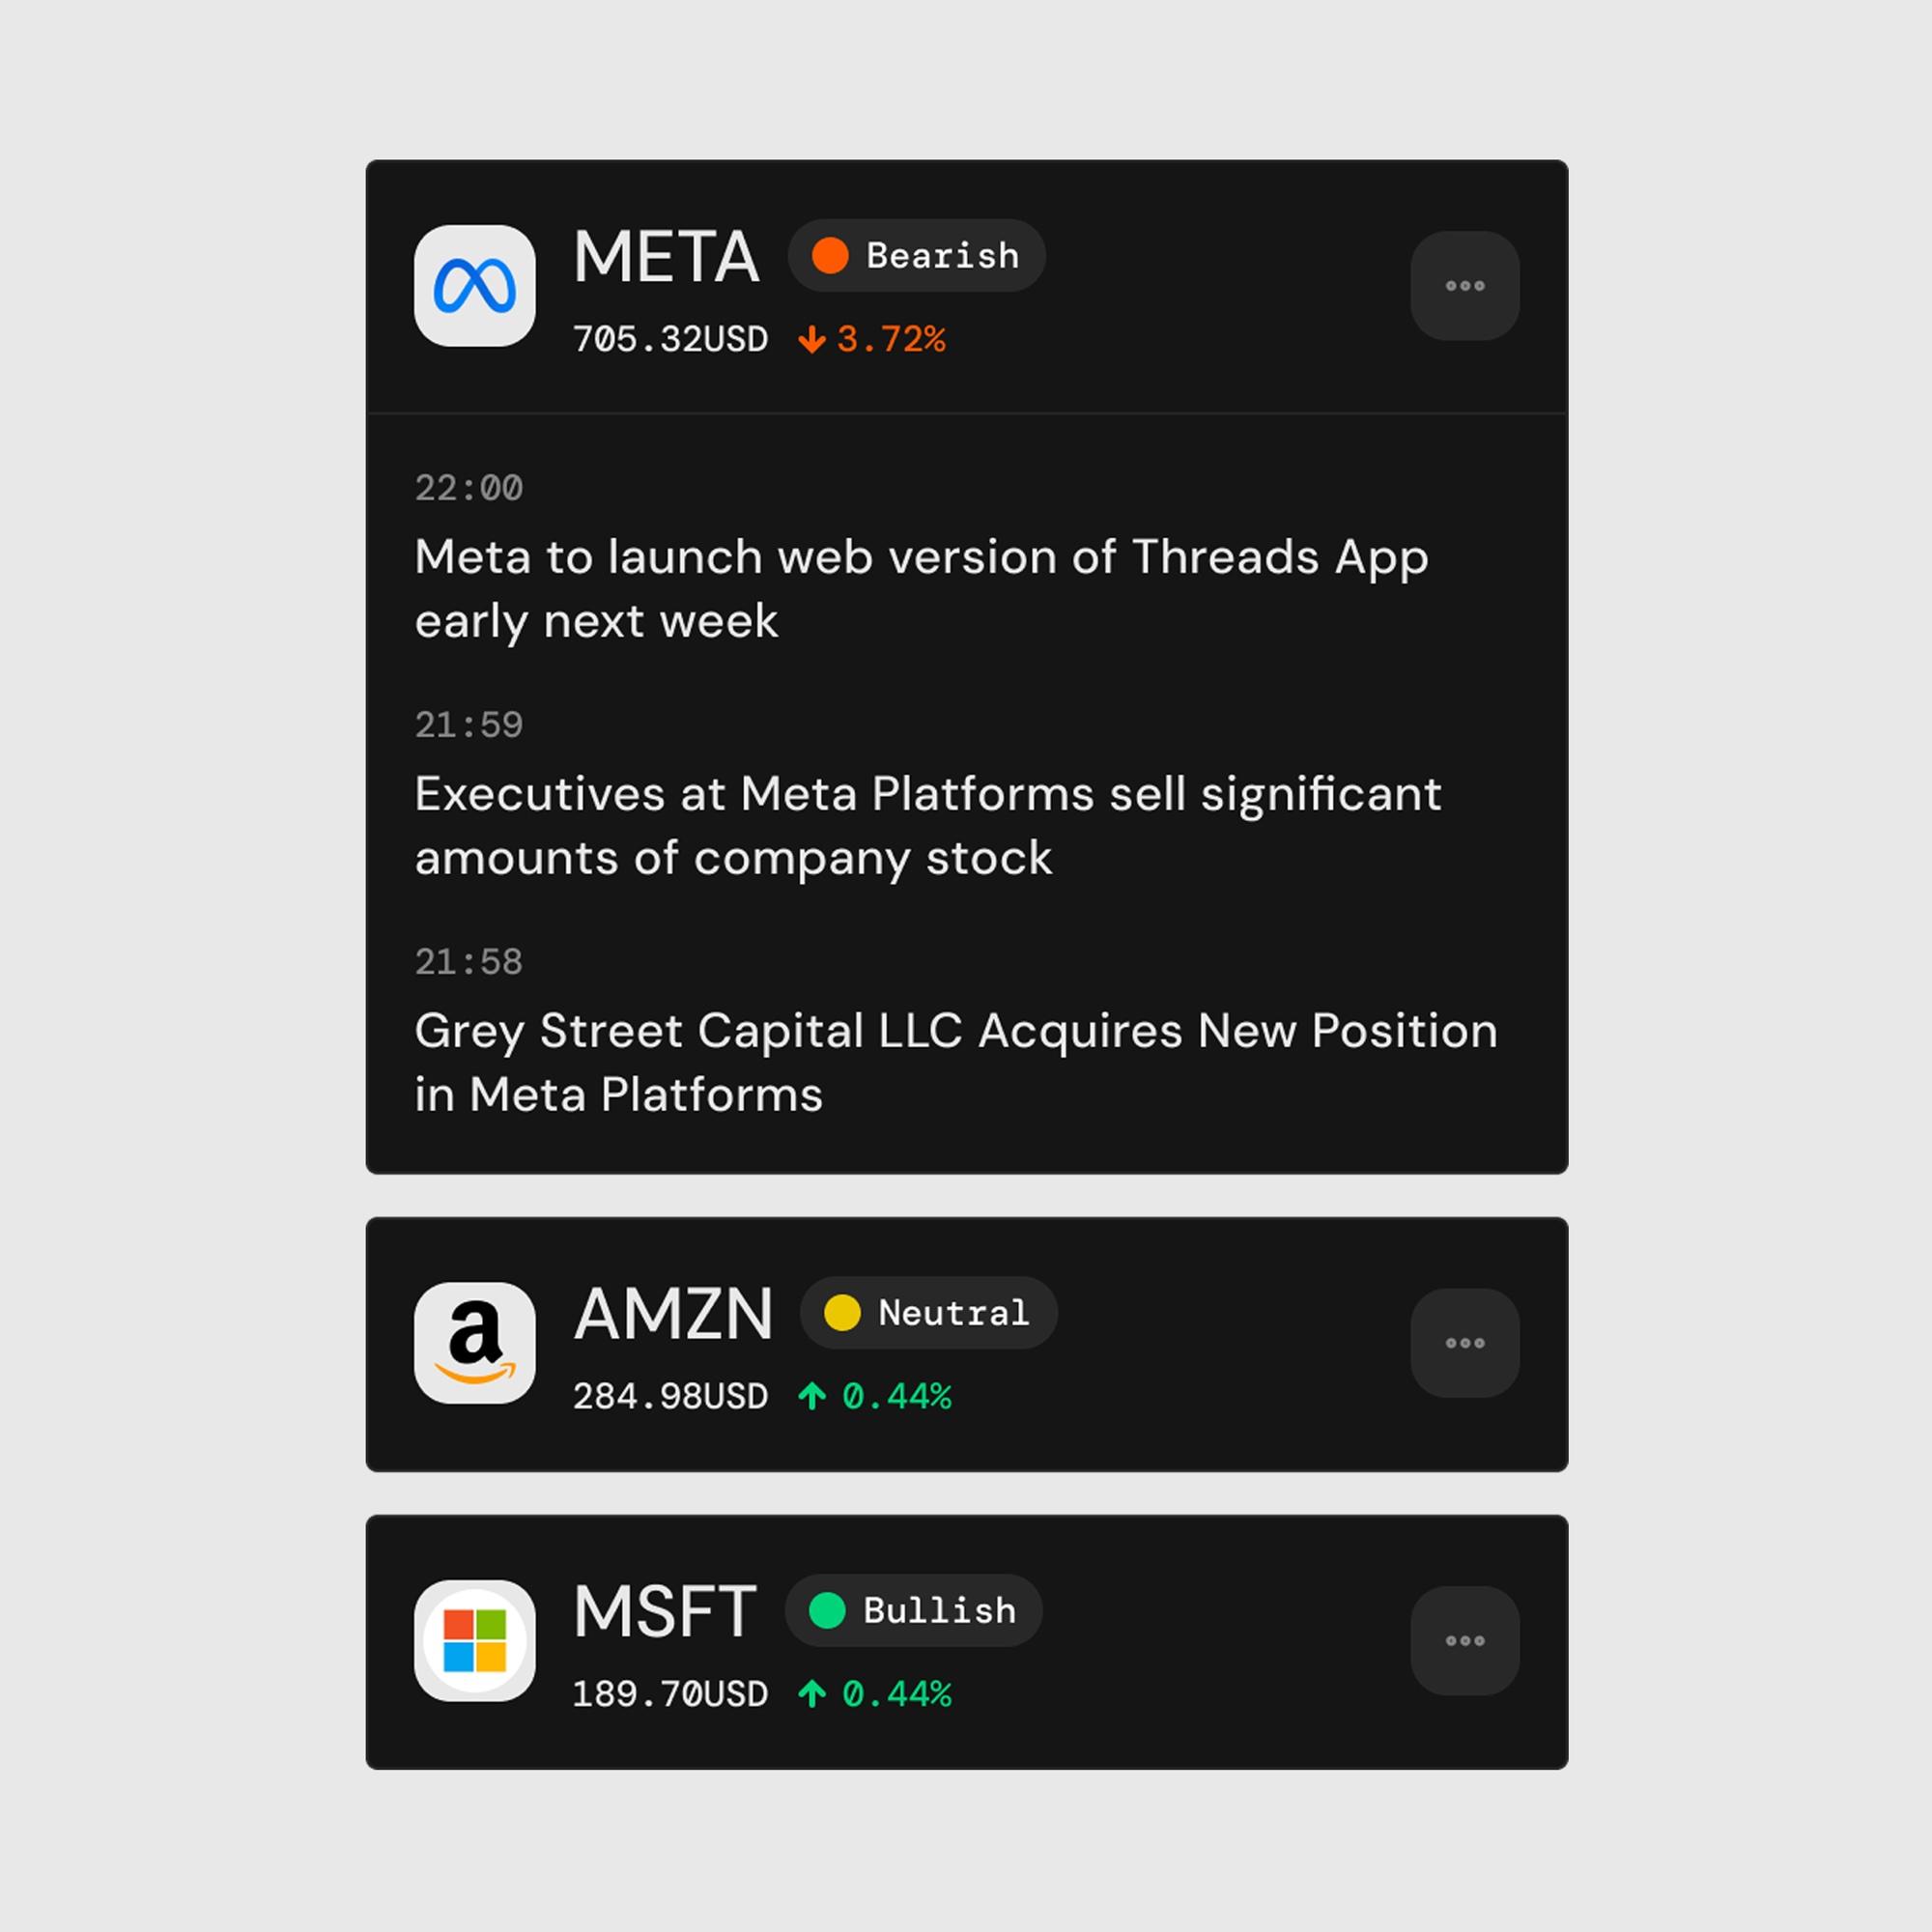
Display news summaries by company, sorted by each stock’s weight in the investor’s portfolio
Usability Testing
Are we showing users what actually matters?
| Source | Feedback | Design next step |
|---|---|---|
| Retail investor Amy | Retail investors also follow stocks they don’t own or watch. | Include broader market news and high-volatility stocks. |
| Retail investor Luke | Users read headlines first and check price performance second. | Prioritize the news headlines, make price data secondary. |
| AI engineer | Major news can affect several companies at once. | Visualize the relationship between a single news and multiple tickers. |
| AI engineer | News about the same stock vary in importance and sentiment. | Rank by individual news priority, surface sentiment. |
Solution
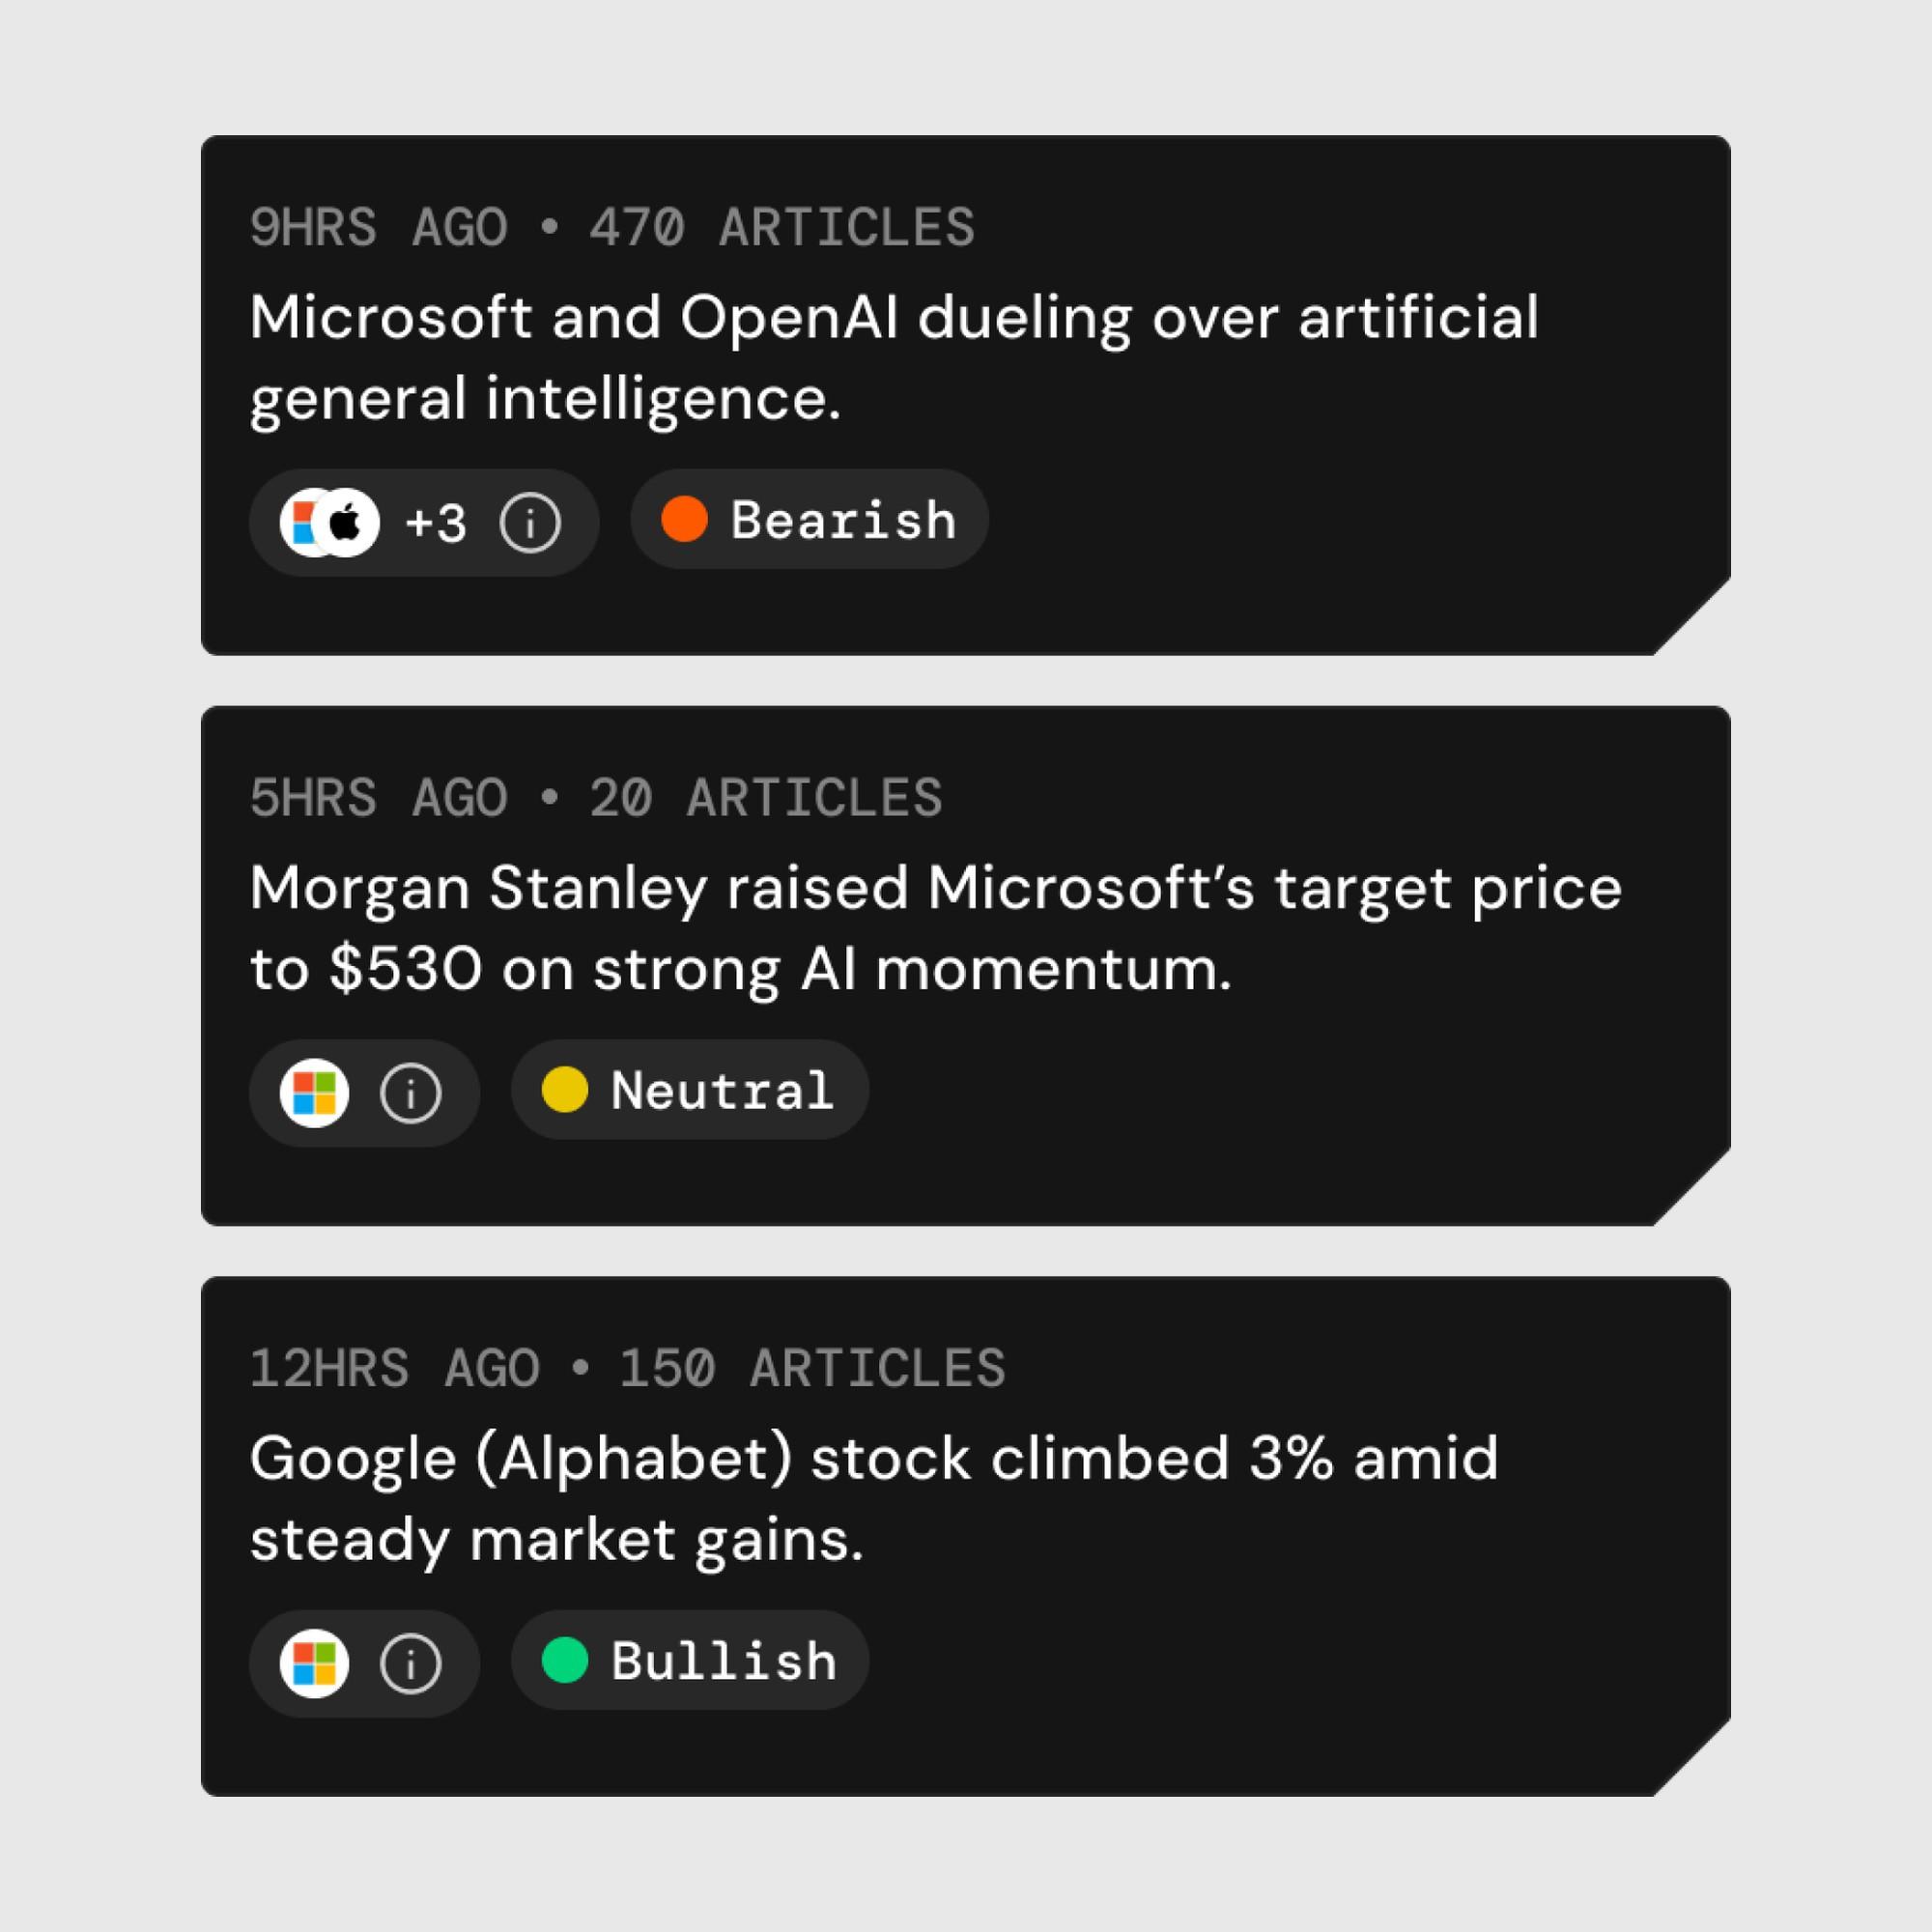
Display by each headline, sort based on the impact to the investors’ portfolios and the market.

In each news individual page, investors can see the other stocks impacted by the single news.
User Painpoint 2
Retail investors know something changed, but not what it means for their portfolio and what to do next.
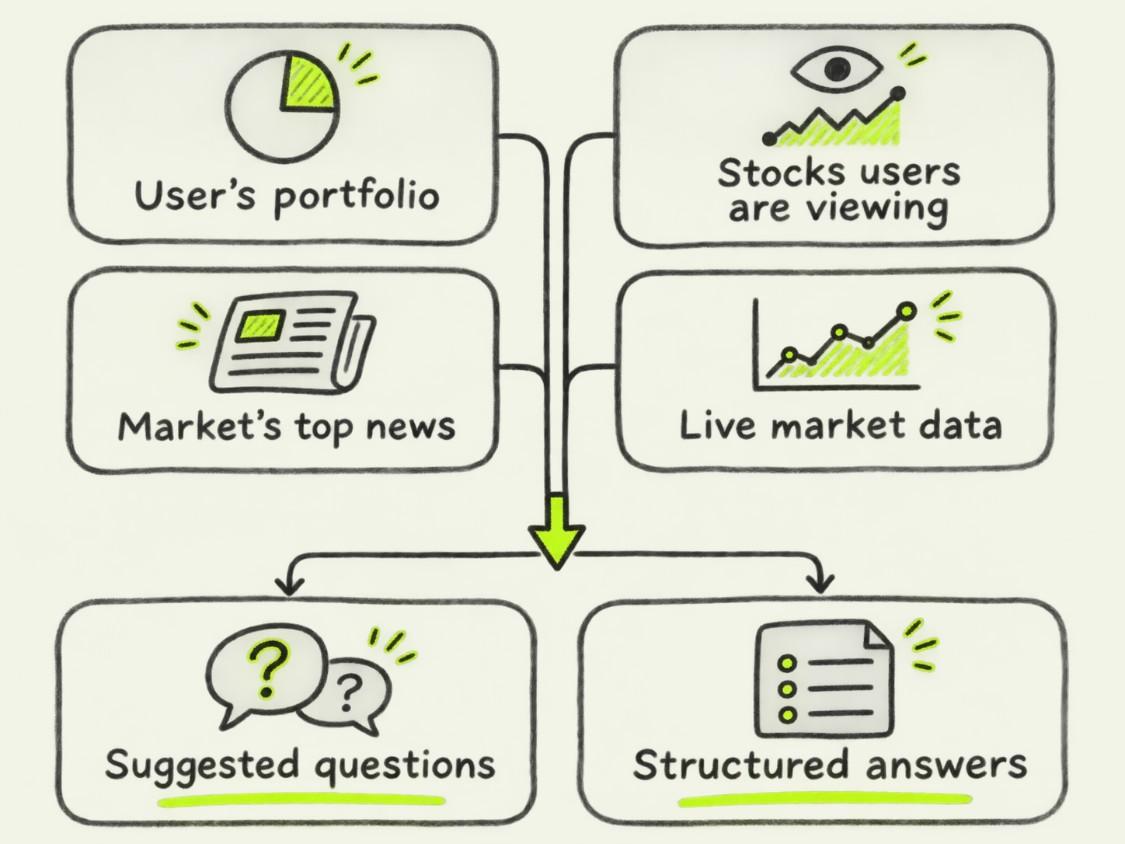
To tackle this problem, we designed a conversational AI assistant “Ask Capy”.
Design Challenge
How and where should Ask Capy appear to stay discoverable while reducing cognitive load?
Exploration
A dedicated tab in the bottom navigation bar.
Usability Testing
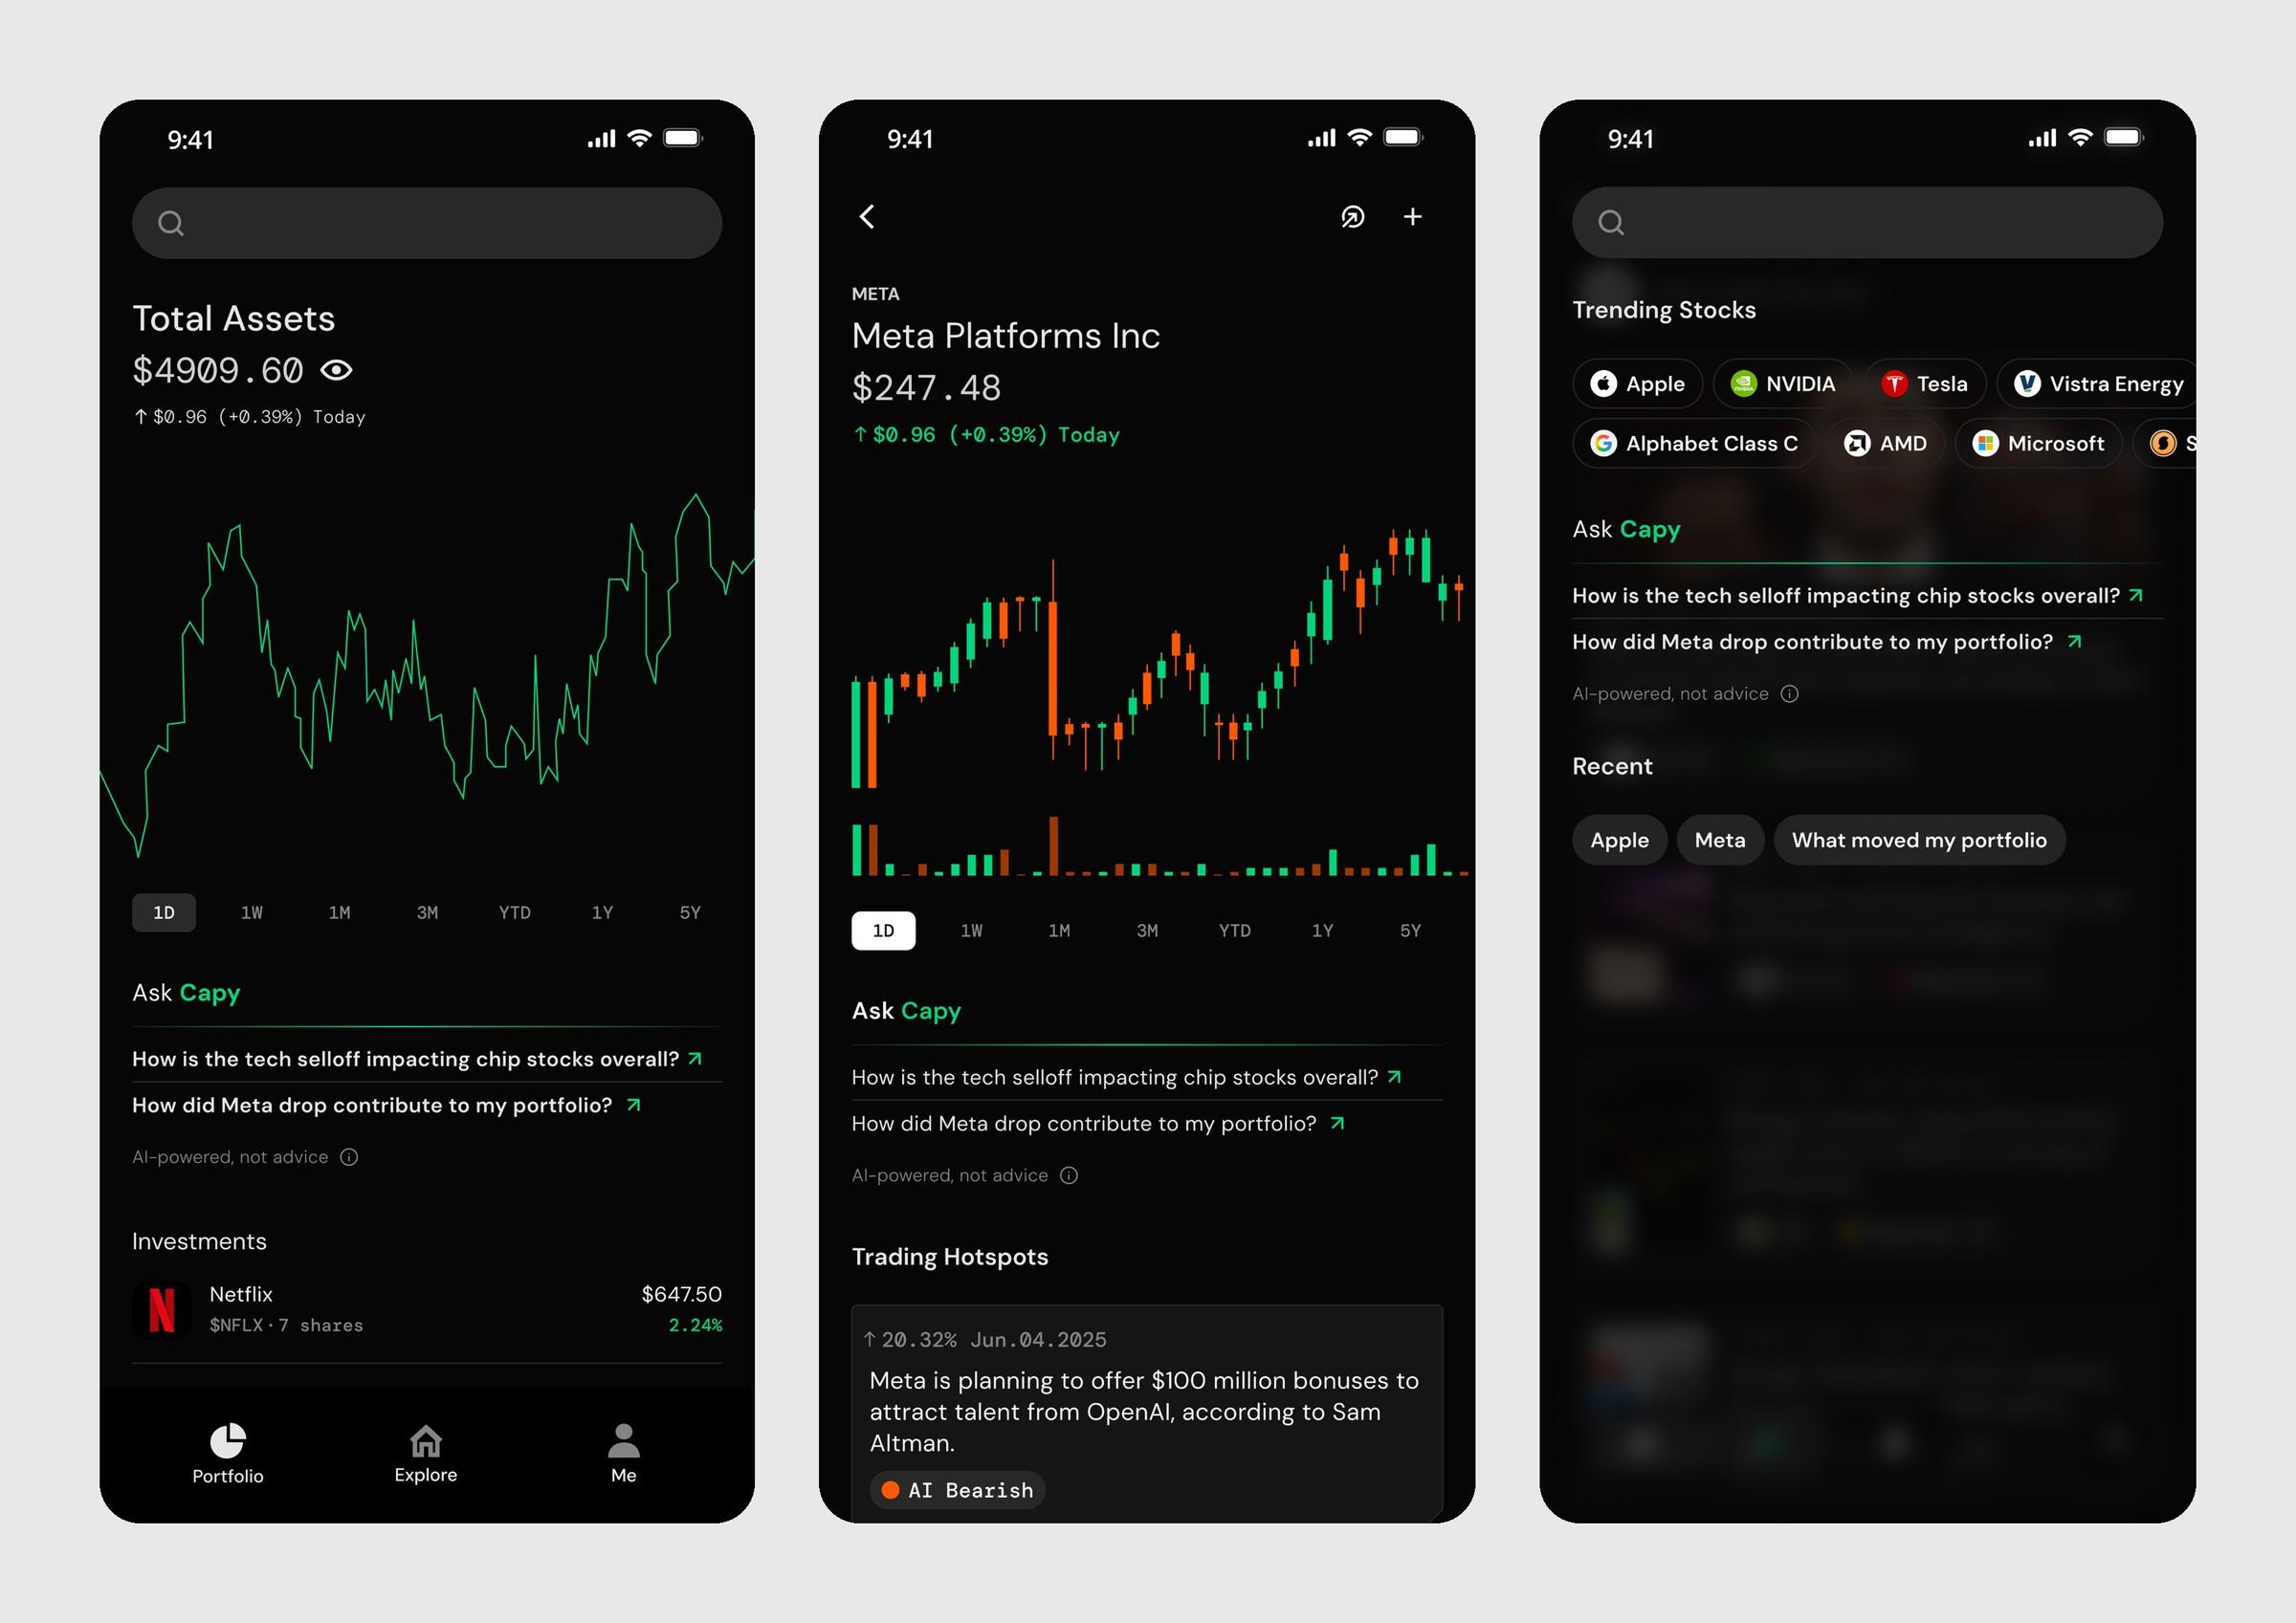
Users’ questions come up while reading news, tracking stock prices, and viewing their portfolio performance, not when they first open the app.
Solution
Add an Ask Capy section with question prompts that tie directly to the user’s portfolio, their stocks, and the day’s top news.
AI & Design
However, the AI output is very lengthy and dense. How to make AI answers easier to scan and understand?
Therefore, I built an AI skill that turns key data comparisons into visual charts.
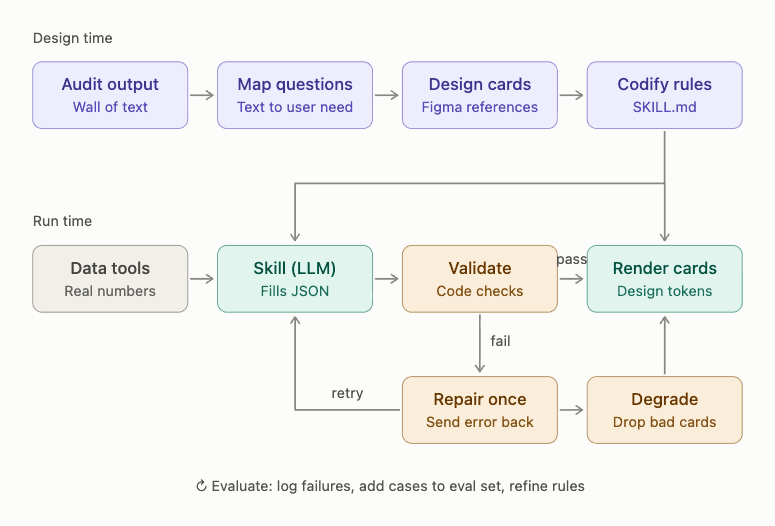
After applying the AI skill, the output contains data visualizations that make it easier to understand.
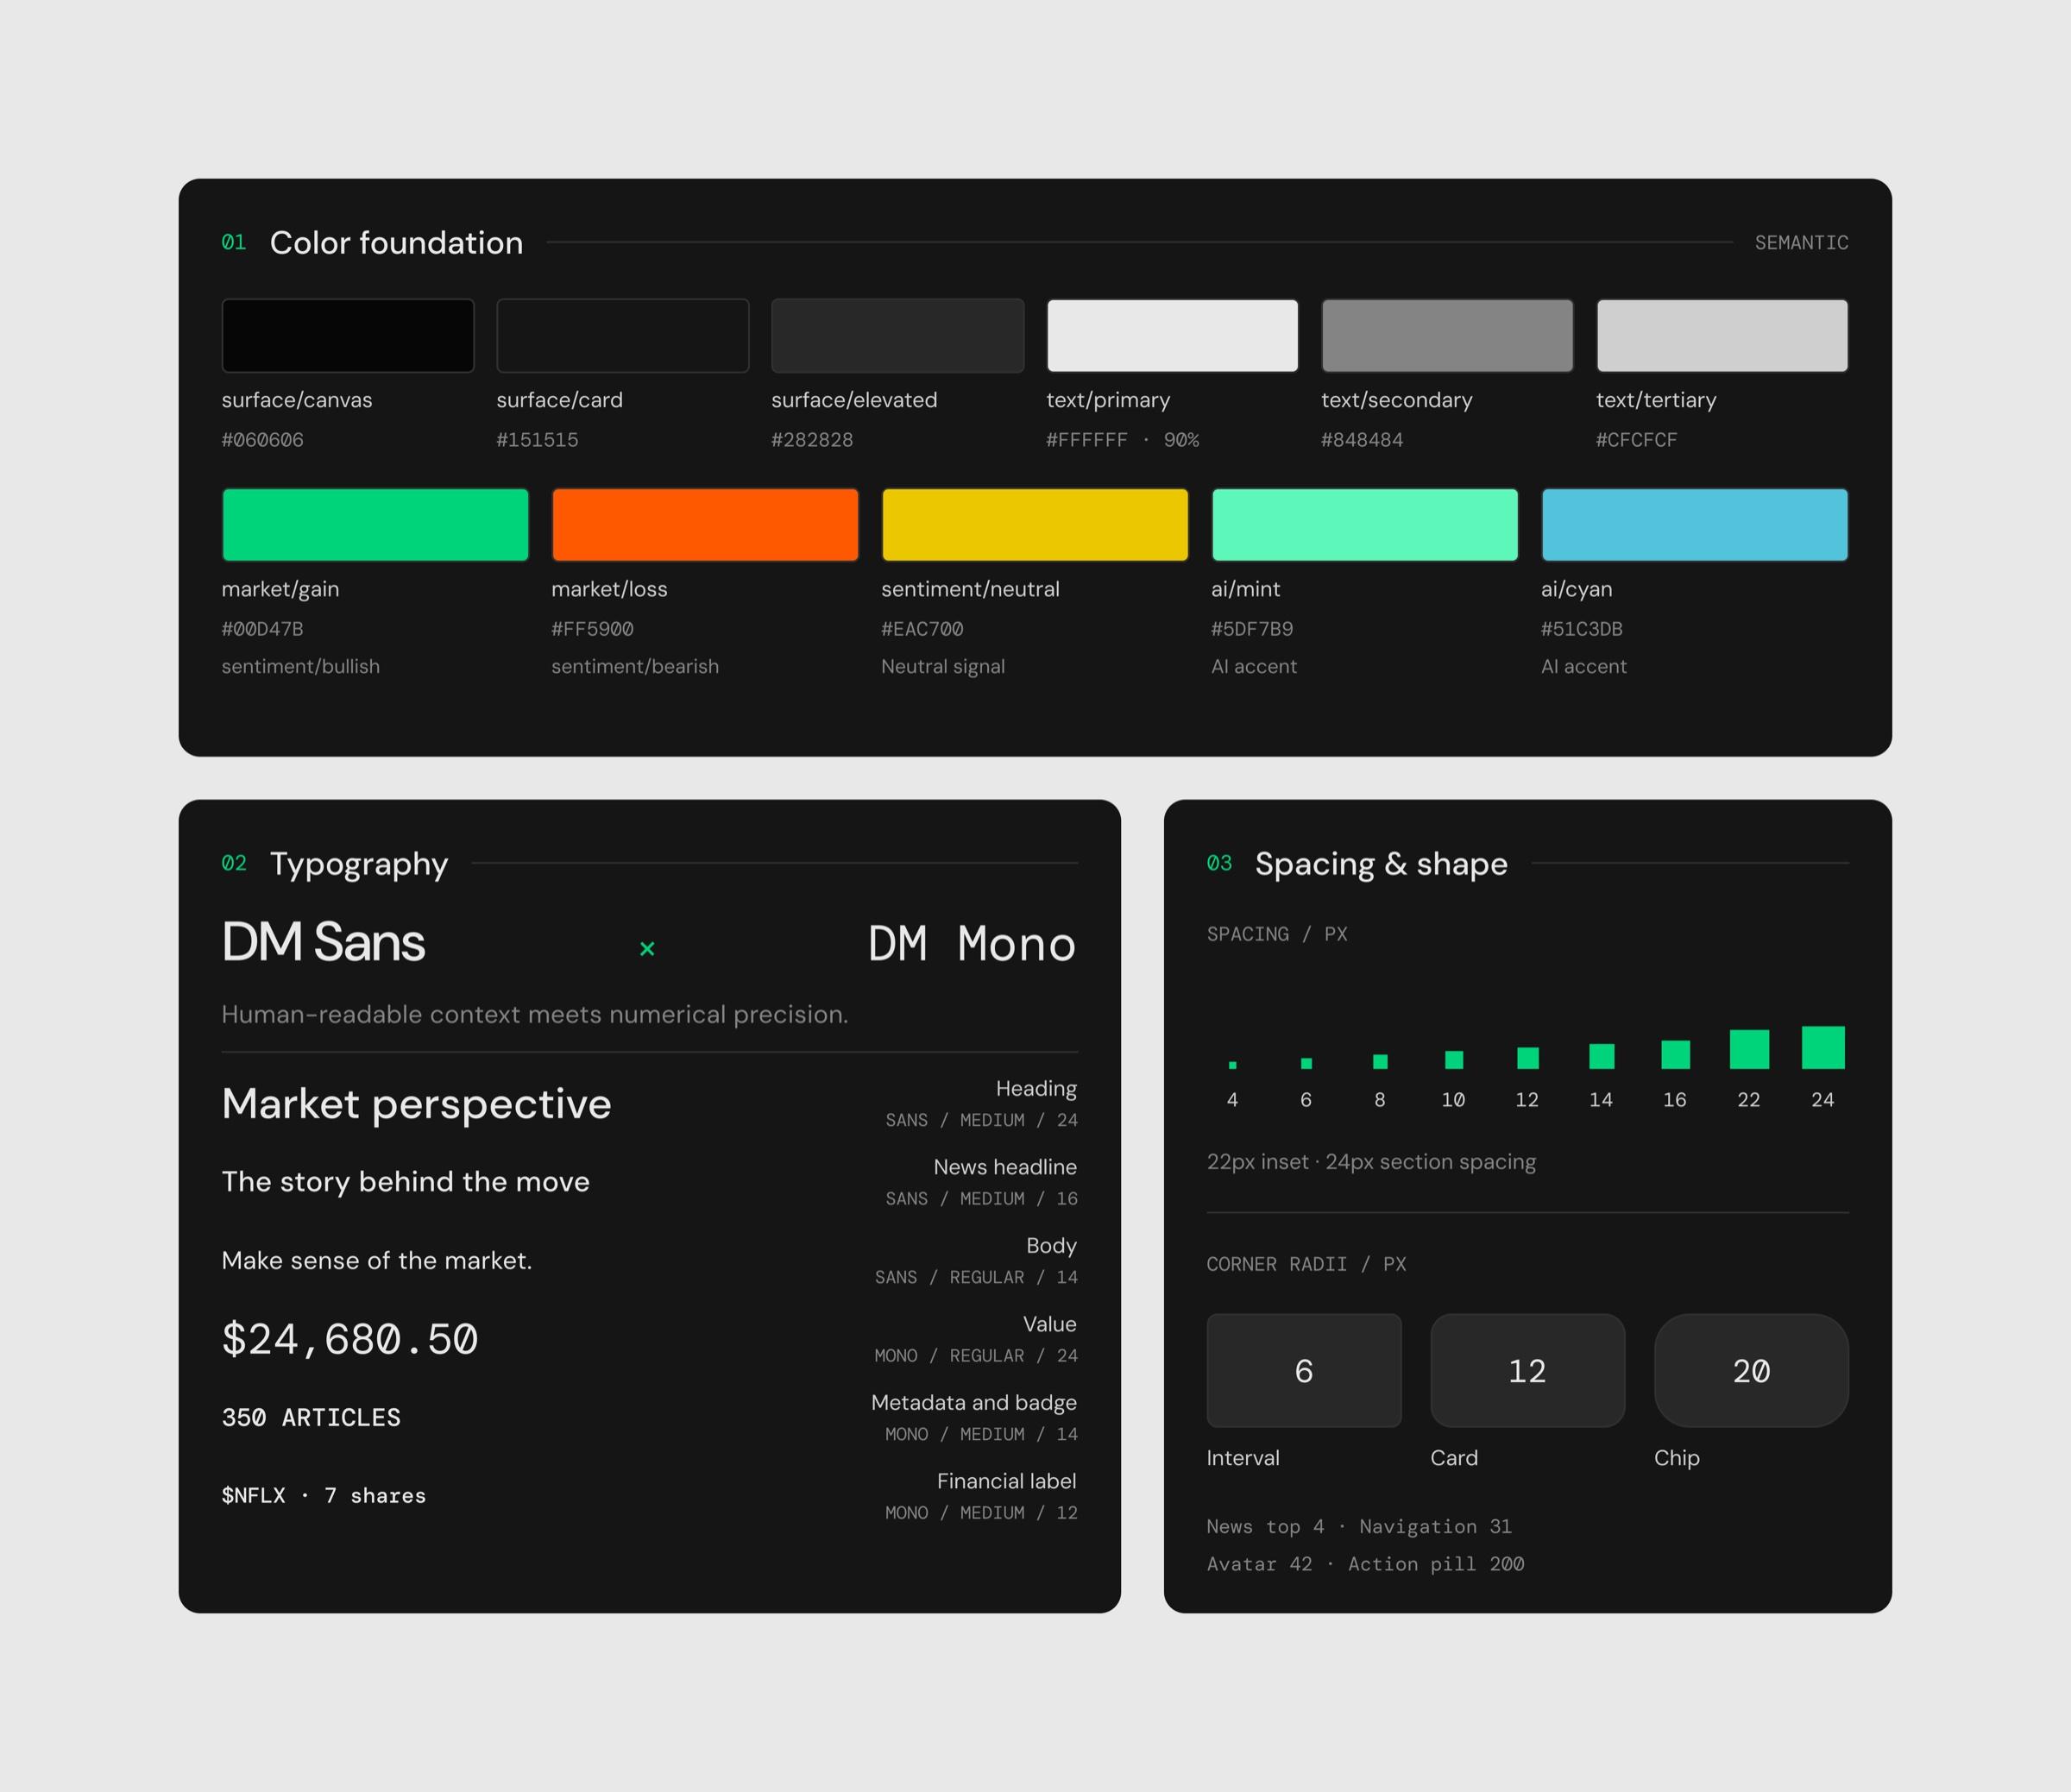
Design System
Brand & Visual Identity
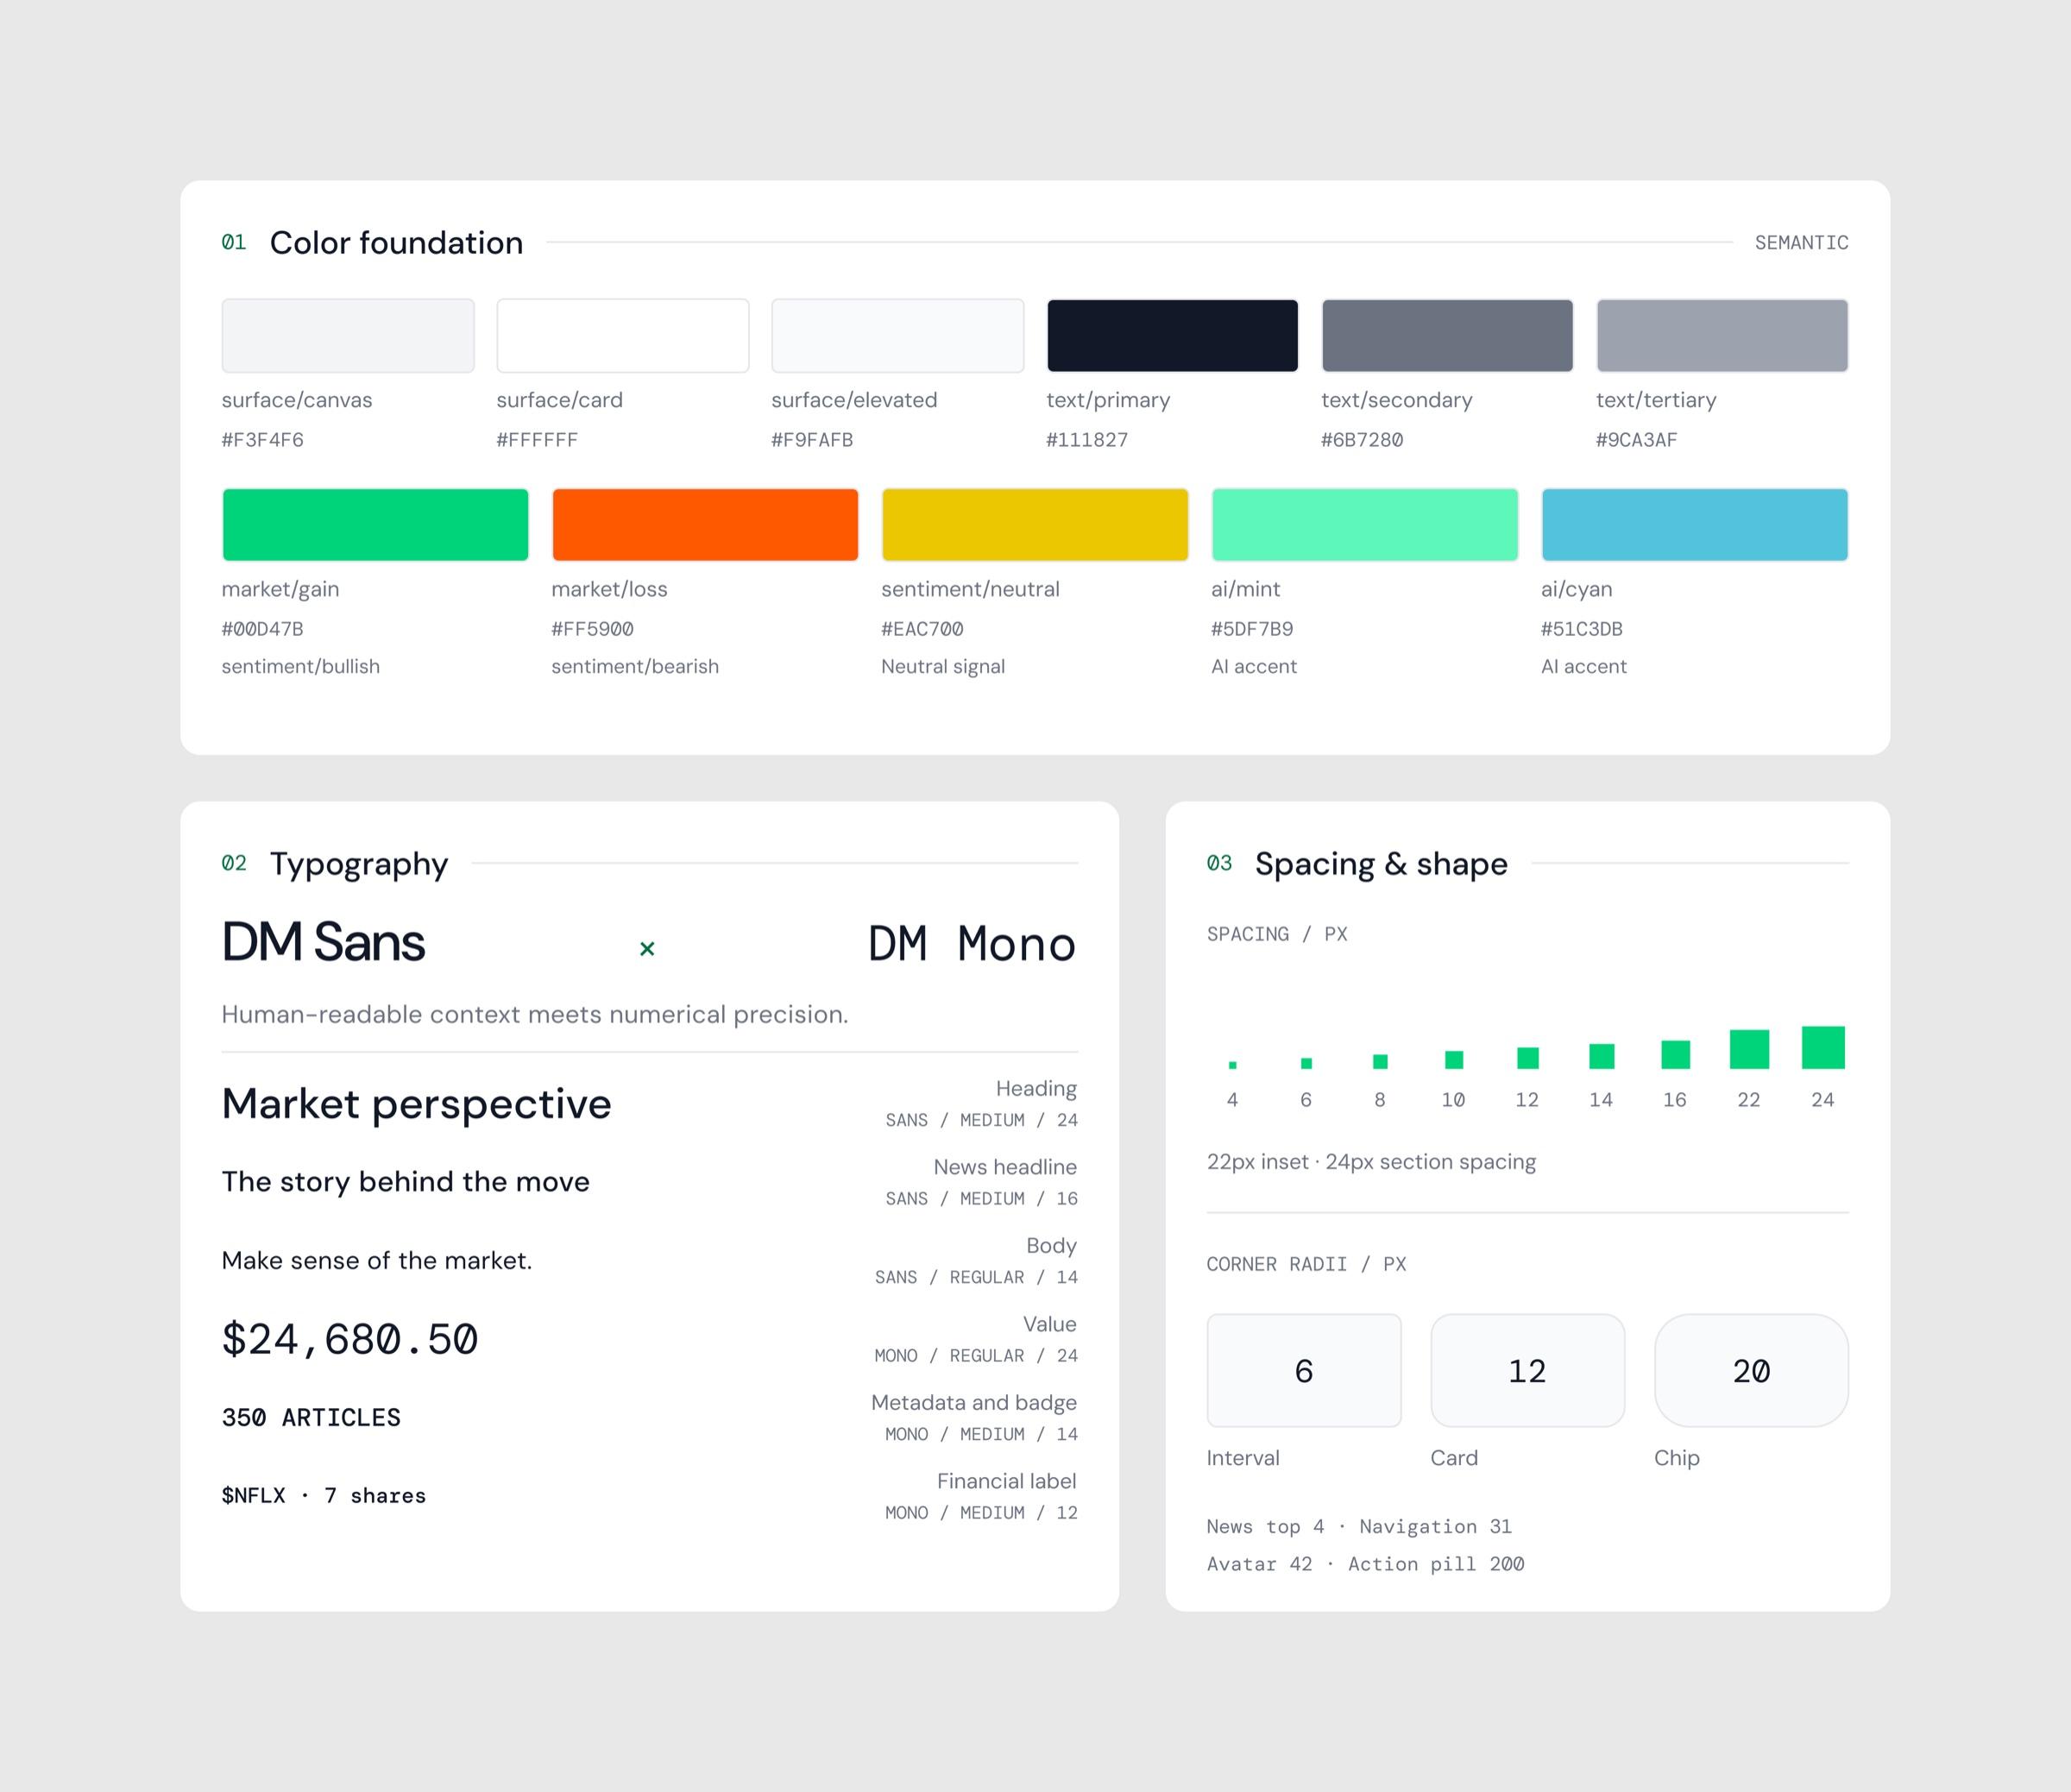
Building the brand, visual language, and design system from scratch to give a new product a credible, trustworthy voice.
Key learnings
What I took away
- 01
The system’s logic isn’t the user’s logic.
I learned to question designs that feel natural to the system but not to the user.
- 02
The best moment to offer help is the moment the question arises.